The Dar es Salaam Stock Exchange (DSE) Market Review for September 2026 by Kadoo Securities shows the All Share Index up 4.82% and equity turnover of TZS 233.3 billion, with total market capitalisation adding TZS 1,864.99 billion.
Kadoo Securities Co. Limited is a Tanzanian securities brokerage and investment advisory firm whose research department publishes this Dar es Salaam Stock Exchange market review every month, covering equities, exchange-traded funds, bonds and investor flows.
The September 2026 edition was prepared by analysts Gilbert Ouma and Erick Sindatuma using DSE daily market reports, equity and bond prices and key market indicators available through 30 September 2026.
September at a Glance
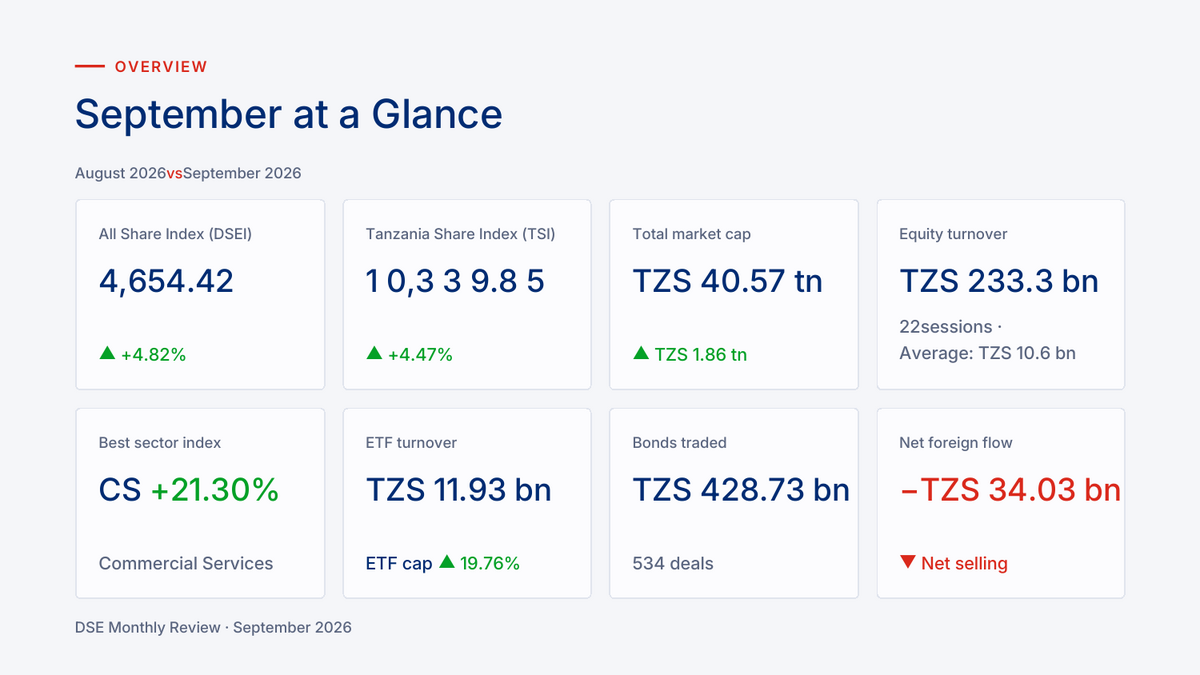
The All Share Index (DSEI) closed September at 4,654.42, up 4.82%, while the Tanzania Share Index (TSI) ended the month at 10,339.85, up 4.47%, both measured against their 31 August levels.
Total market capitalisation reached TZS 40,573.59 billion, an increase of TZS 1,864.99 billion, and the Commercial Services index was the best performing sector index, gaining 21.30%.
Equity turnover totalled TZS 233.3 billion across 22 sessions, an average of TZS 10.6 billion a session, and foreign investors were net sellers of TZS 34.03 billion over the month.
Beyond equities, exchange-traded fund turnover was TZS 11.93 billion with ETF market capitalisation up 19.76%, and bonds traded on the exchange totalled TZS 428.73 billion across 534 deals.
Market Indices
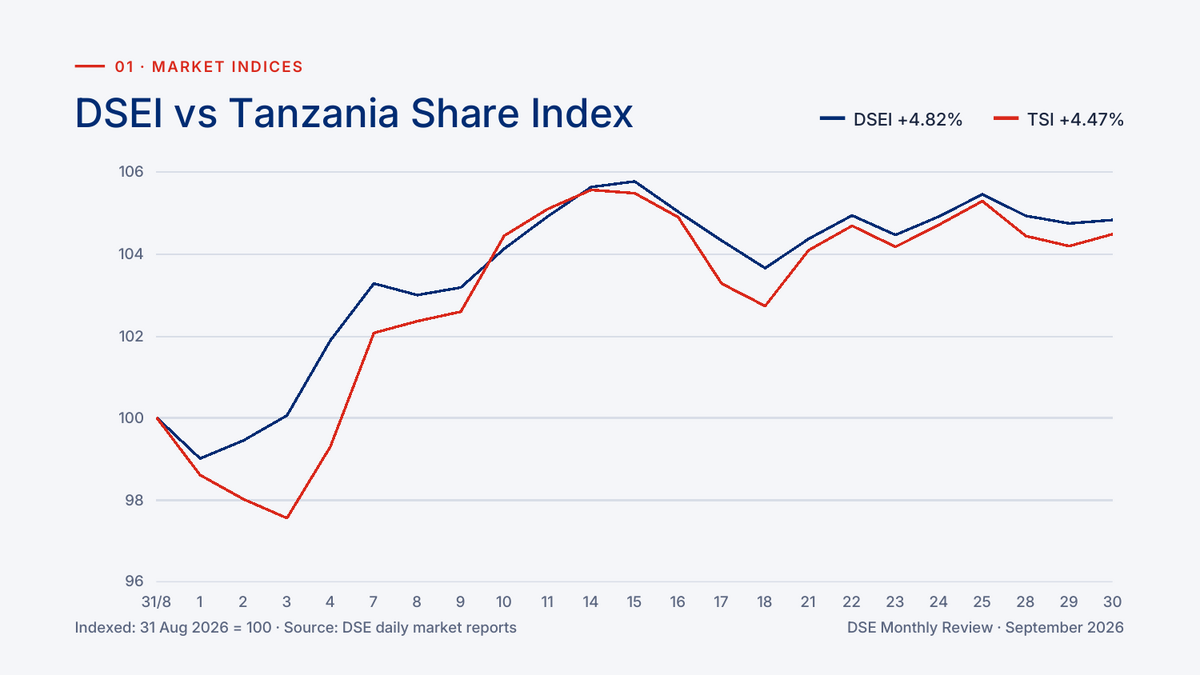
Indexed to 31 August at 100, both indices dipped in the opening days of September before climbing to a mid-month peak on 15 September.
A mild pull-back followed, leaving the All Share Index up 4.82% and the Tanzania Share Index up 4.47% at the close on 30 September.
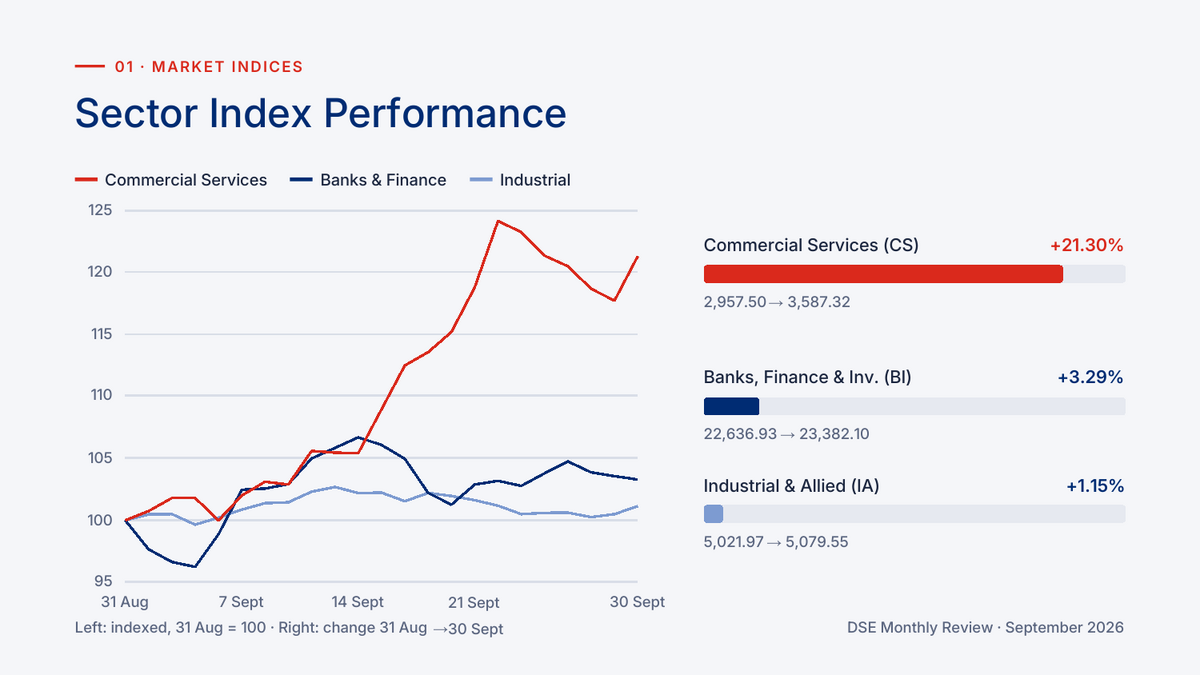
The Commercial Services (CS) index led the three sector indices with a gain of 21.30%, rising from 2,957.50 to 3,587.32 between 31 August and 30 September.
The Banks, Finance and Investment (BI) index rose 3.29% from 22,636.93 to 23,382.10, while the Industrial and Allied (IA) index gained 1.15% from 5,021.97 to 5,079.55.
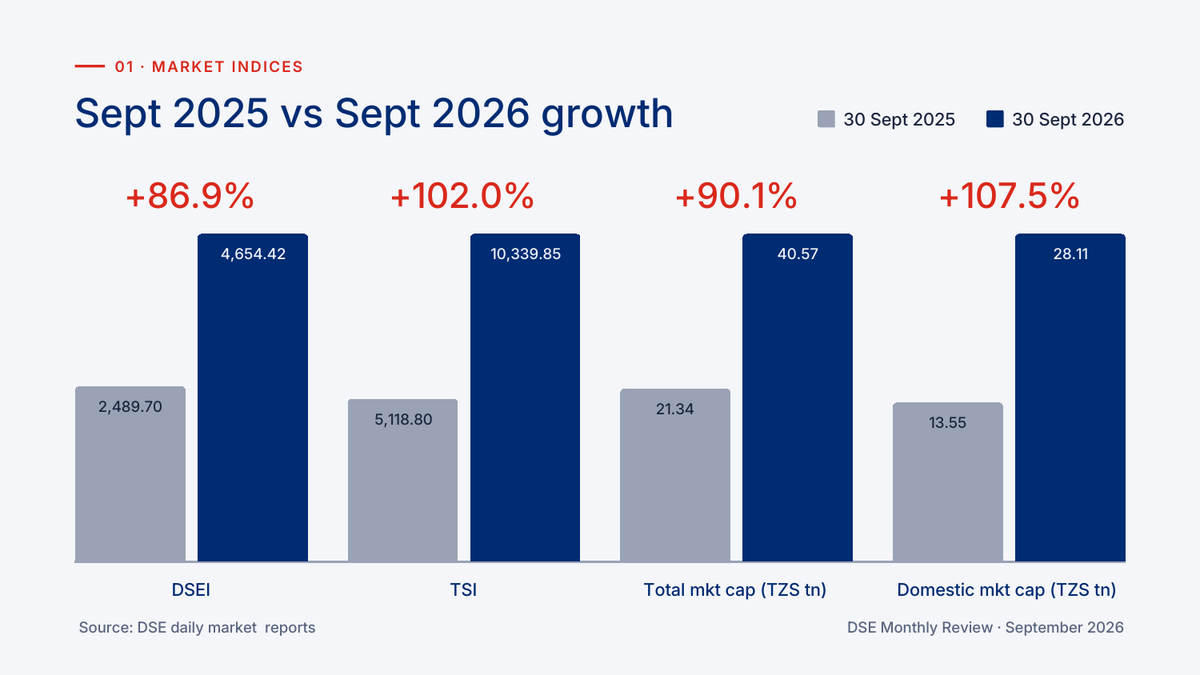
Compared with 30 September 2025, the All Share Index was up 86.9%, rising from 2,489.70 to 4,654.42, and the Tanzania Share Index was up 102.0%, rising from 5,118.80 to 10,339.85.
Total market capitalisation grew 90.1% from TZS 21.34 trillion to TZS 40.57 trillion over the same twelve months, while domestic market capitalisation grew 107.5% from TZS 13.55 trillion to TZS 28.11 trillion.
Market Capitalisation
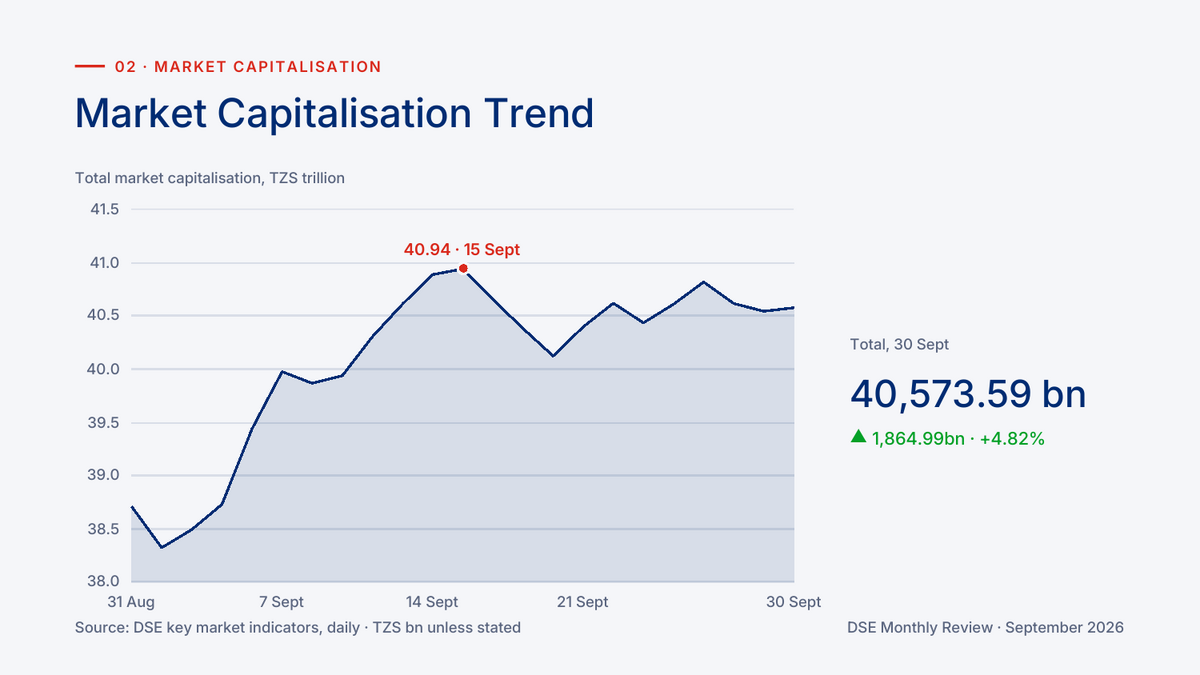
Total market capitalisation stood at TZS 40,573.59 billion on 30 September, up TZS 1,864.99 billion or 4.82% on the month, after peaking at TZS 40.94 trillion on 15 September.
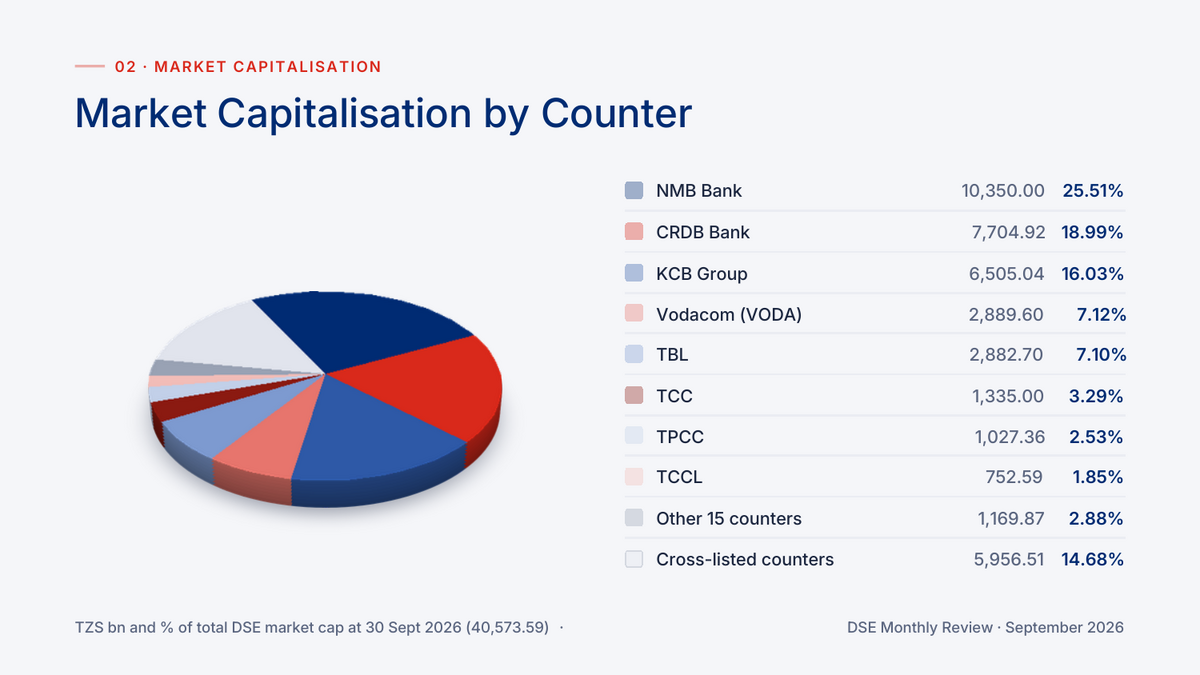
The distribution of that capitalisation by counter at 30 September 2026, with each counter’s share of the total, is set out below.
- NMB Bank Plc (DSE: NMB): TZS 10,350.00 billion, 25.51%
- CRDB Bank Plc (DSE: CRDB): TZS 7,704.92 billion, 18.99%
- KCB Group Plc (DSE: KCB): TZS 6,505.04 billion, 16.03%
- Vodacom Tanzania Plc (DSE: VODA): TZS 2,889.60 billion, 7.12%
- Tanzania Breweries Plc (DSE: TBL): TZS 2,882.70 billion, 7.10%
- Tanzania Cigarette Company Plc (DSE: TCC): TZS 1,335.00 billion, 3.29%
- Tanzania Portland Cement Plc (DSE: TPCC): TZS 1,027.36 billion, 2.53%
- Tanga Cement Plc (DSE: TCCL): TZS 752.59 billion, 1.85%
- Other 15 counters: TZS 1,169.87 billion, 2.88%
- Cross-listed counters: TZS 5,956.51 billion, 14.68%
Turnover and Liquidity
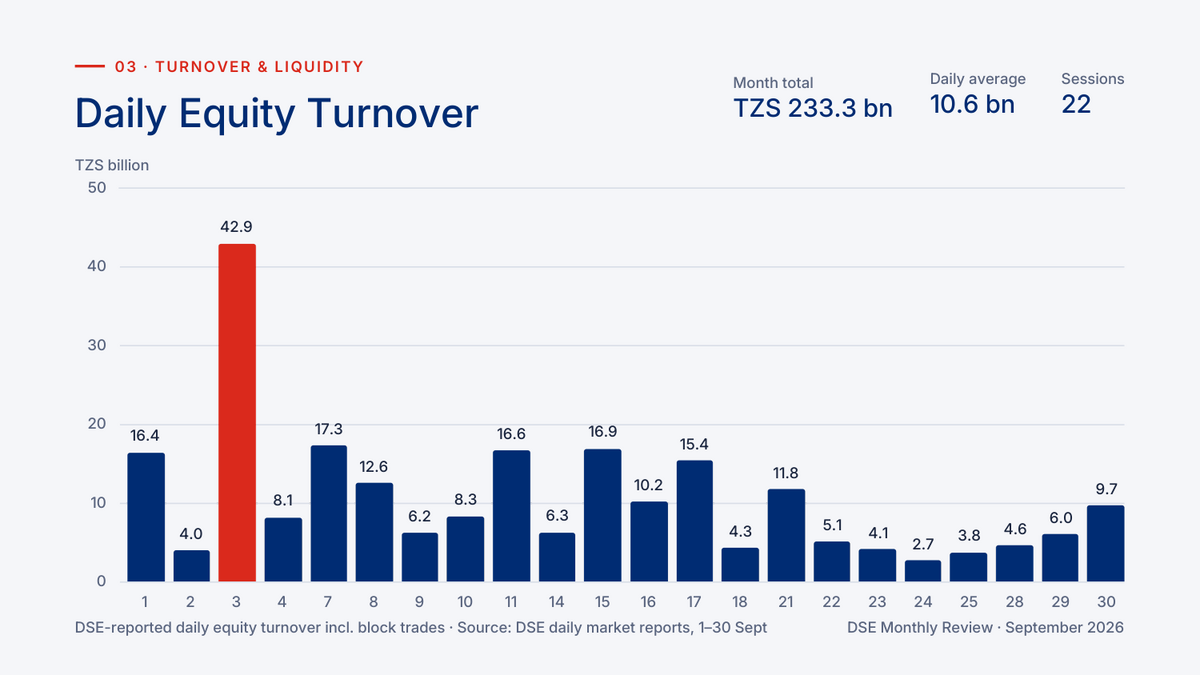
Equity turnover totalled TZS 233.3 billion over 22 sessions in September, an average of TZS 10.6 billion a day, including block trades reported by the exchange.
The busiest session was 3 September at TZS 42.9 billion, followed by TZS 17.3 billion on 7 September, TZS 16.9 billion on 15 September and TZS 16.6 billion on 11 September.
The quietest day of the month was 24 September, when turnover fell to TZS 2.7 billion, the lowest daily total of the 22 sessions.
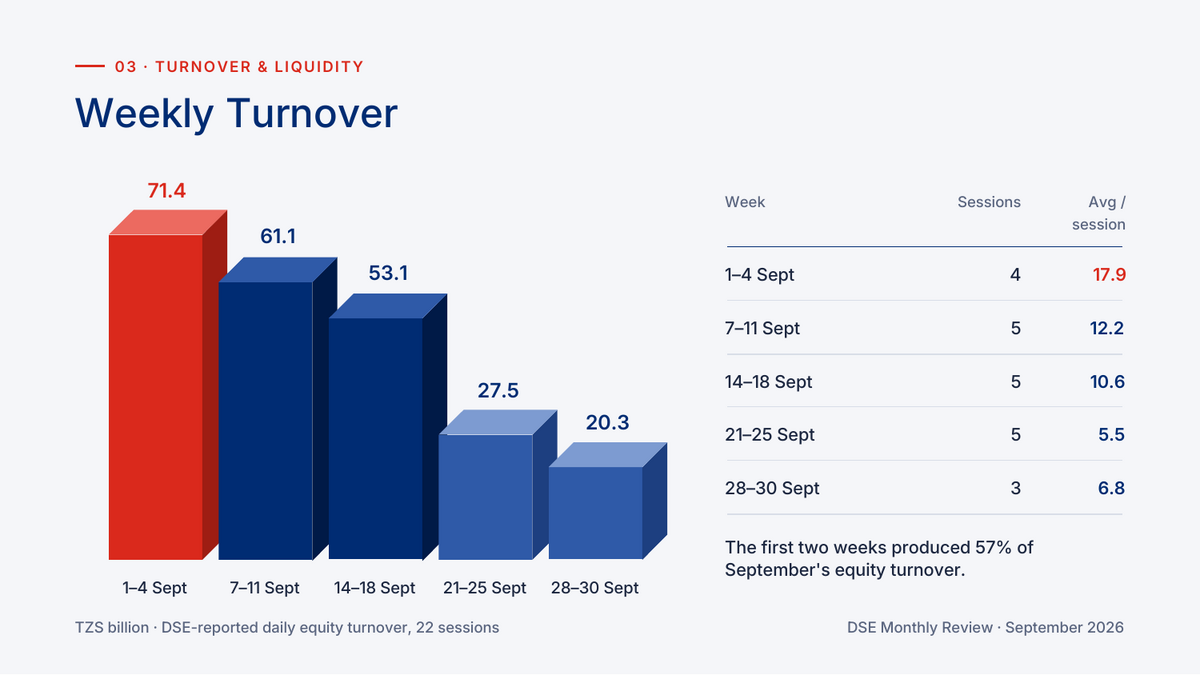
Weekly turnover fell steadily through the month, from TZS 71.4 billion in the four sessions of 1 to 4 September to TZS 61.1 billion in the week of 7 to 11 September.
Turnover then declined to TZS 53.1 billion and TZS 27.5 billion in the next two weeks, before ending at TZS 20.3 billion in the three sessions of 28 to 30 September.
The first two weeks of the month produced 57% of September’s equity turnover, with the average per session standing at TZS 17.9 billion in the first week and TZS 12.2 billion in the second.
Average turnover per session was TZS 10.6 billion, TZS 5.5 billion and TZS 6.8 billion in the three remaining weeks of the month.
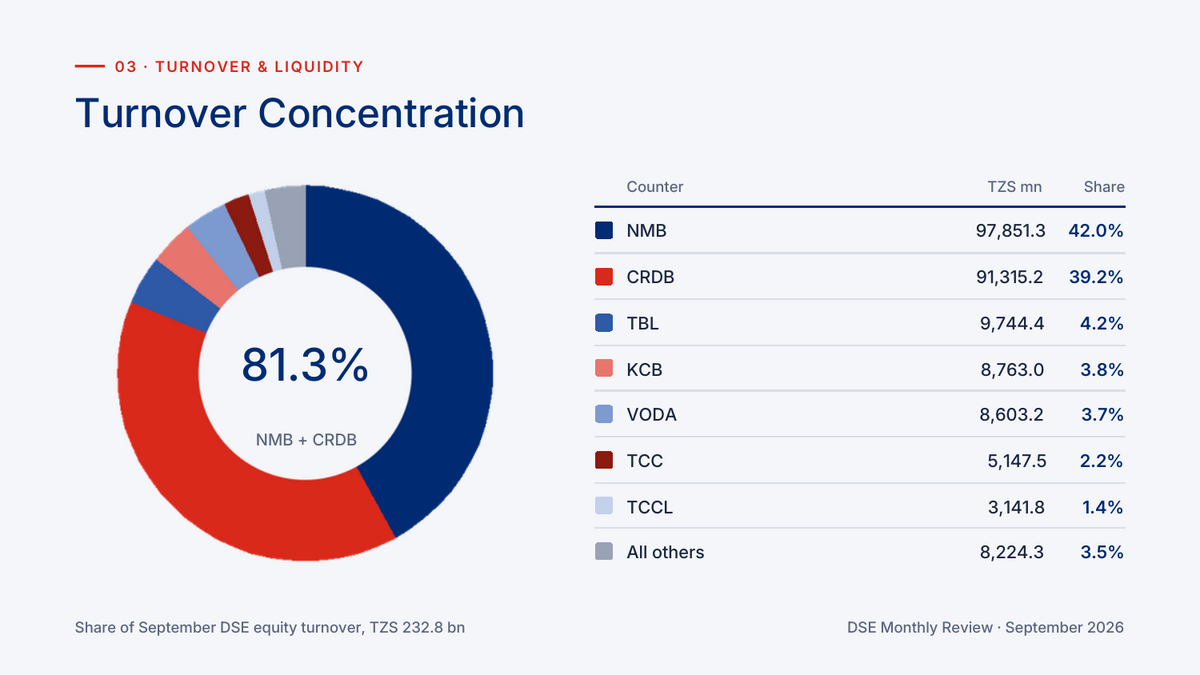
NMB and CRDB together accounted for 81.3% of September equity turnover, with NMB at TZS 97,851.3 million or 42.0% and CRDB at TZS 91,315.2 million or 39.2%, in a counter breakdown covering TZS 232.8 billion.
TBL followed at TZS 9,744.4 million or 4.2%, KCB at TZS 8,763.0 million or 3.8% and VODA at TZS 8,603.2 million or 3.7% of September turnover.
TCC accounted for TZS 5,147.5 million or 2.2% and TCCL for TZS 3,141.8 million or 1.4%, with all other counters sharing TZS 8,224.3 million or 3.5%.
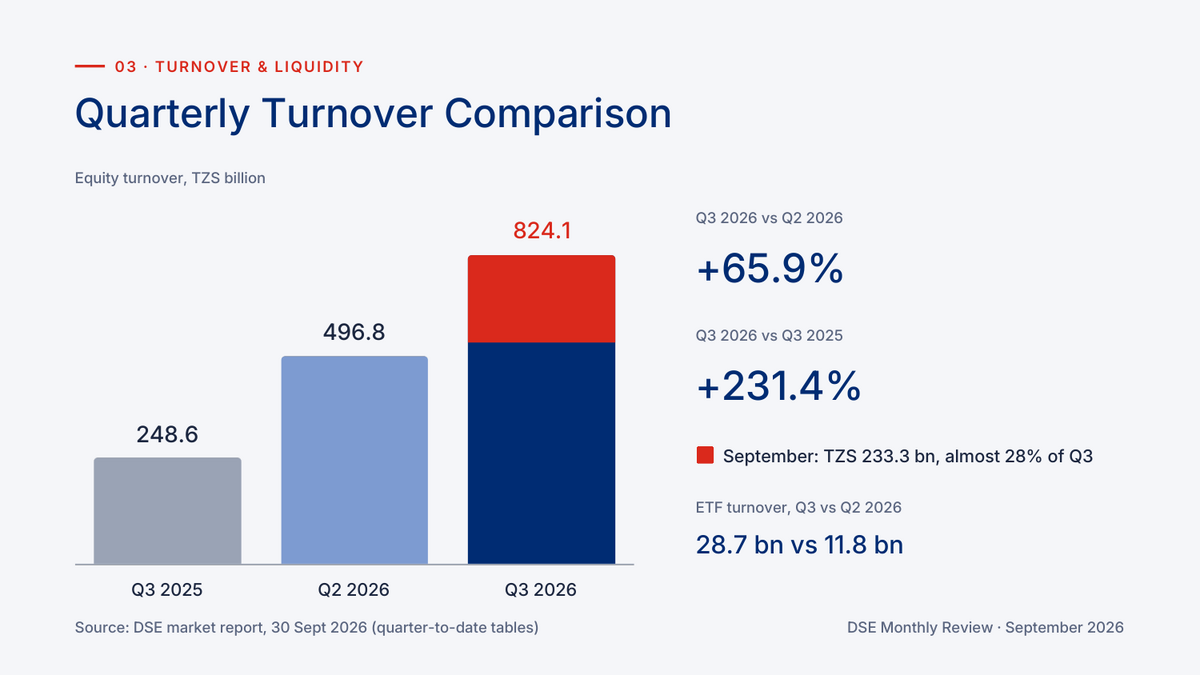
Third-quarter equity turnover reached TZS 824.1 billion, up 65.9% from TZS 496.8 billion in the second quarter of 2026 and up 231.4% from TZS 248.6 billion in the third quarter of 2025.
September contributed TZS 233.3 billion to that quarterly total, while ETF turnover for the quarter was TZS 28.7 billion against TZS 11.8 billion in the second quarter.
Equity Performance
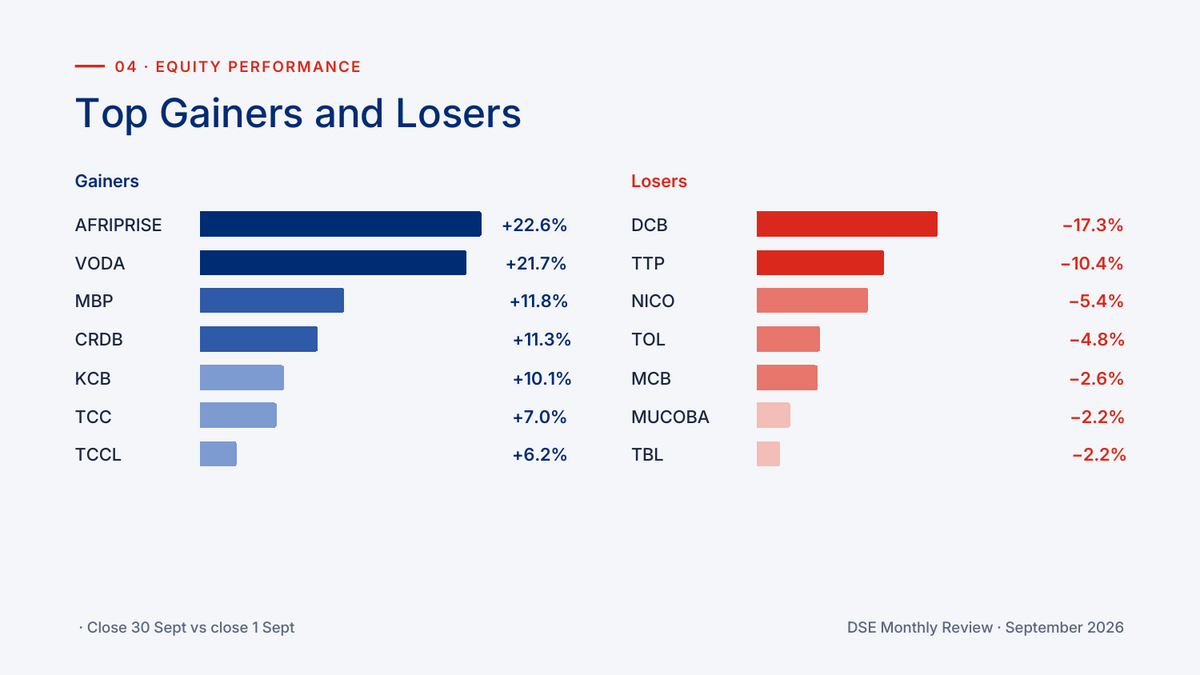
Kadoo measures share price changes from the 1 September close to the 30 September close, and the seven strongest gainers over that period were as follows.
- Afriprise Investment Plc (DSE: AFRIPRISE): +22.6%
- VODA: +21.7%
- Maendeleo Bank Plc (DSE: MBP): +11.8%
- CRDB: +11.3%
- KCB: +10.1%
- TCC: +7.0%
- TCCL: +6.2%
Over the same period, the seven weakest performers on the exchange, listed from the steepest decline downwards, were as follows.
- DCB Commercial Bank Plc (DSE: DCB): -17.3%
- TATEPA Limited (DSE: TTP): -10.4%
- National Investment Company Limited (DSE: NICO): -5.4%
- TOL Gases Limited (DSE: TOL): -4.8%
- Mwalimu Commercial Bank Plc (DSE: MCB): -2.6%
- Mufindi Community Bank (DSE: MUCOBA): -2.2%
- TBL: -2.2%
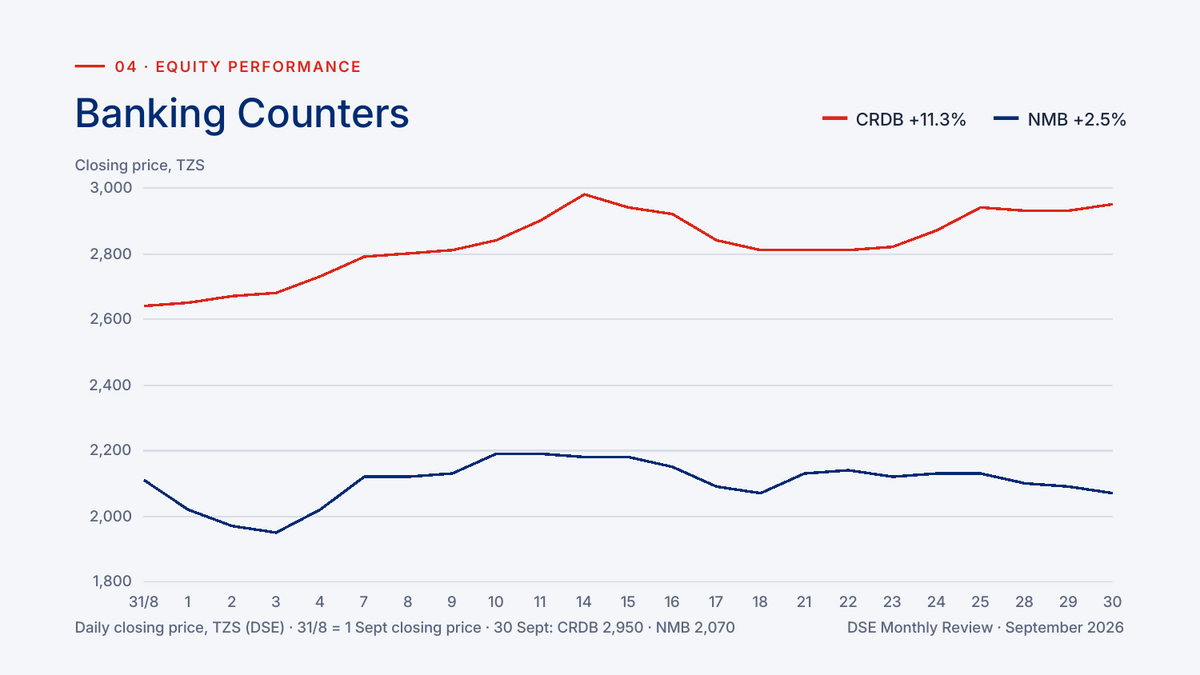
Among the two largest banks, CRDB rose 11.3% from TZS 2,650 to TZS 2,950 between the 1 and 30 September closes, while NMB rose 2.5% from TZS 2,020 to TZS 2,070.
The CRDB profile in the review measures from the 31 August close instead, which gives CRDB a gain of 11.7% from TZS 2,640 and NMB a fall of 1.9% from its 31 August close of TZS 2,110.
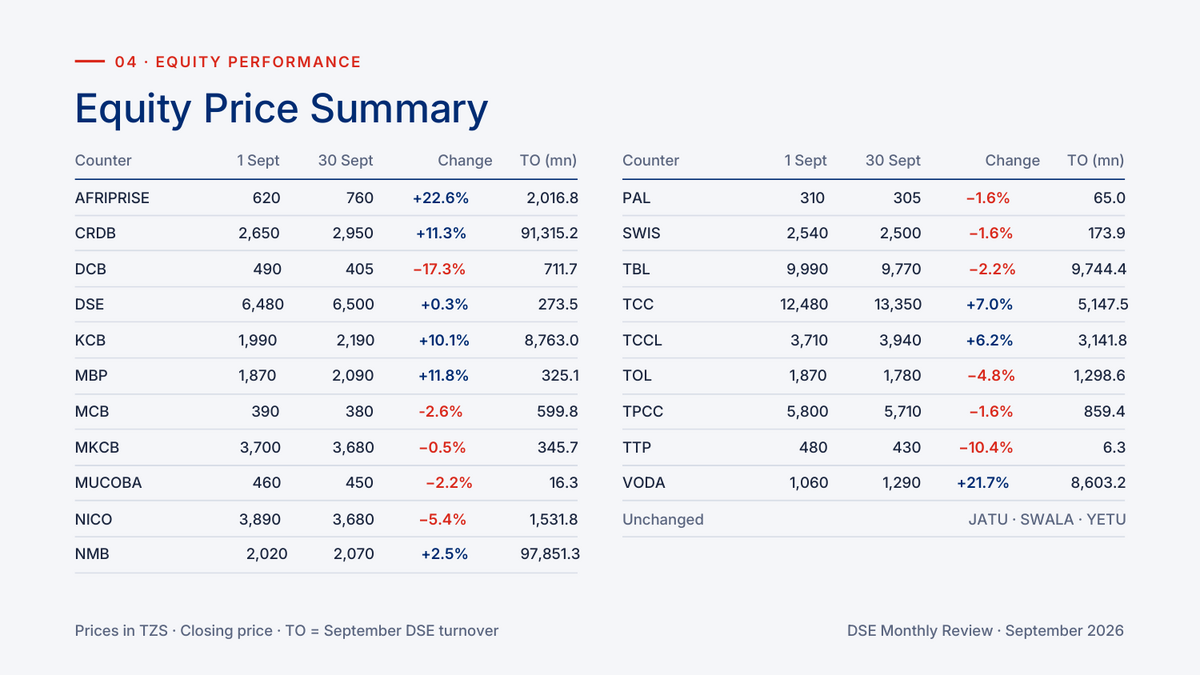
Jatu Plc (DSE: JATU), Swala Gas and Oil (DSE: SWALA) and Yetu Microfinance Bank (DSE: YETU) closed September unchanged, while every other counter in the price summary moved.
Stock Picks
The stock picks section profiles three counters, VODA, CRDB and AFRIPRISE, setting out the price and trading pattern behind each one’s September performance and what drove it.
Vodacom Tanzania Plc
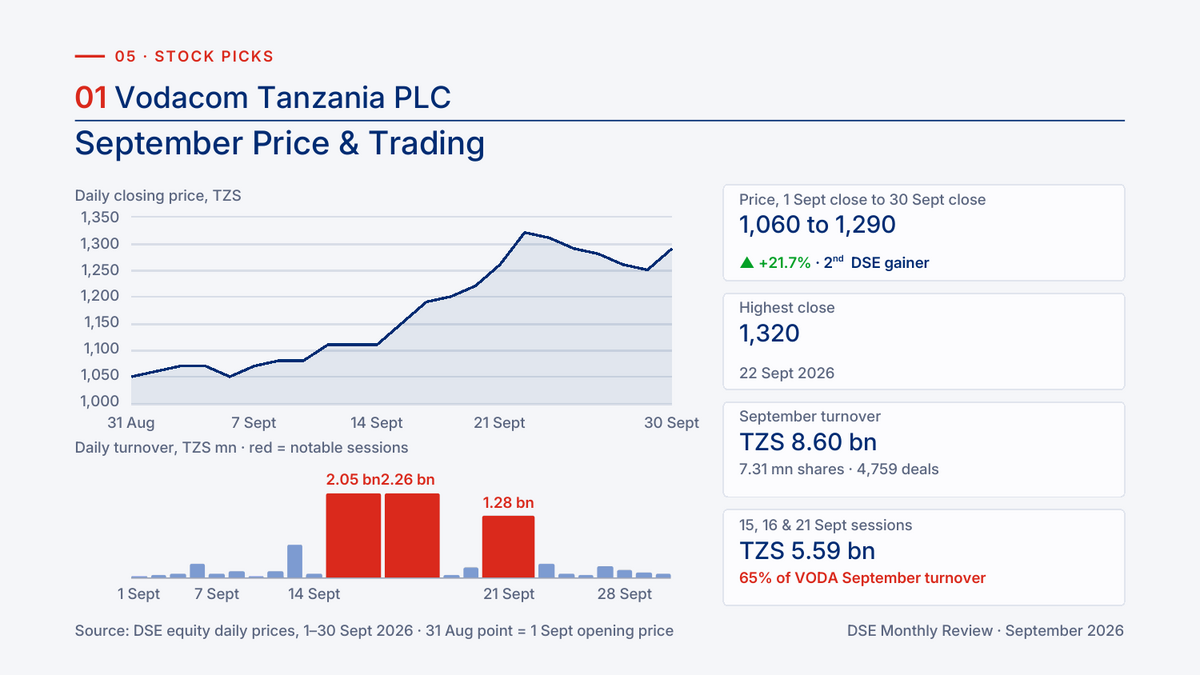
VODA shares rose 21.7% from TZS 1,060 at the 1 September close to TZS 1,290 at the 30 September close, making the counter the second strongest gainer on the exchange in the month.
The highest close was TZS 1,320 on 22 September, and September turnover of TZS 8.60 billion was traded across 7.31 million shares and 4,759 deals.
Sessions on 15, 16 and 21 September accounted for TZS 5.59 billion of that turnover, or 65% of the September total, with the three busiest days at TZS 2.05 billion, TZS 2.26 billion and TZS 1.28 billion.
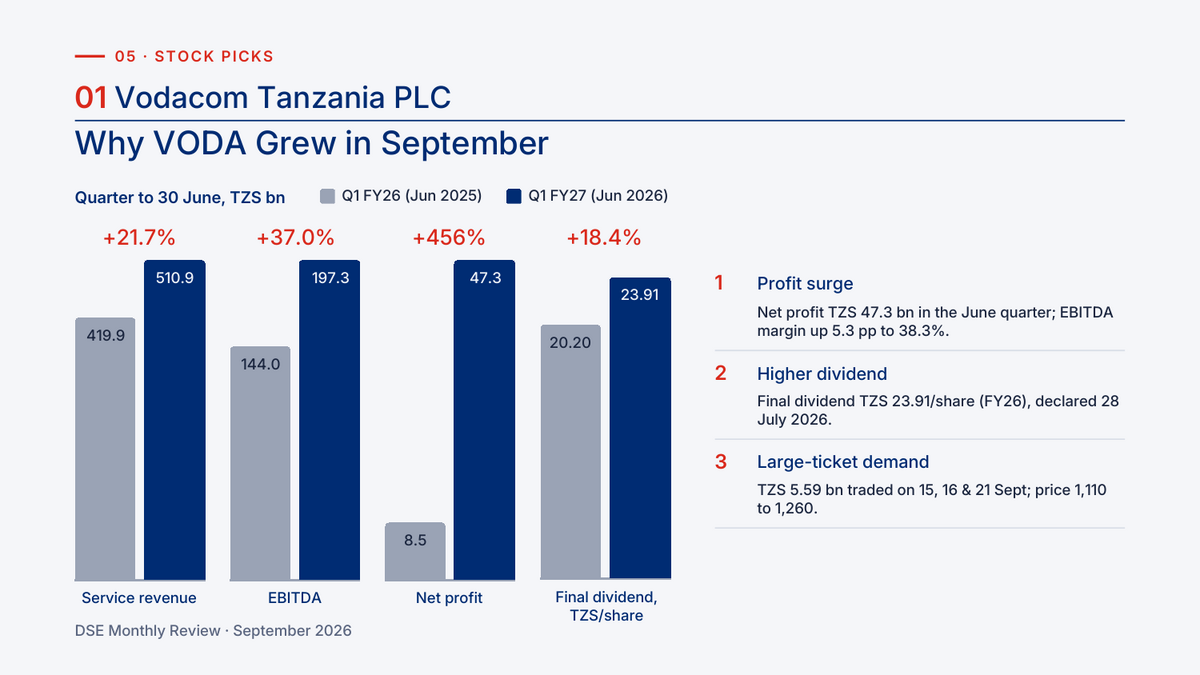
Kadoo attributes the rise to three factors: a surge in profit in the June quarter, a higher final dividend and large-ticket demand in the market.
Net profit reached TZS 47.3 billion in the quarter to 30 June 2026 against TZS 8.5 billion a year earlier, an increase of 456%, while service revenue rose 21.7% to TZS 510.9 billion from TZS 419.9 billion.
EBITDA grew 37.0% to TZS 197.3 billion from TZS 144.0 billion, lifting the EBITDA margin by 5.3 percentage points to 38.3%.
The final dividend for FY26 was TZS 23.91 per share, declared on 28 July 2026, compared with TZS 20.20 per share a year earlier, an increase of 18.4%.
The share price moved from TZS 1,110 to TZS 1,260 across those three large-ticket sessions on 15, 16 and 21 September.
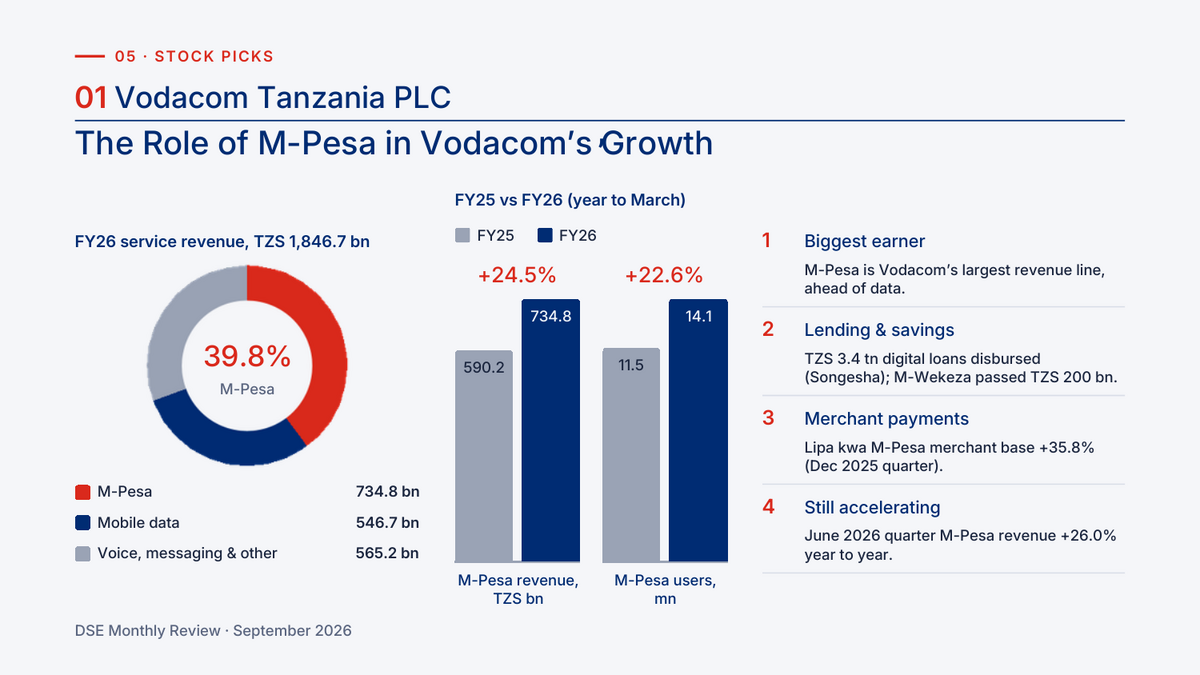
M-Pesa is Vodacom’s largest revenue line, contributing TZS 734.8 billion or 39.8% of FY26 service revenue of TZS 1,846.7 billion, ahead of mobile data at TZS 546.7 billion and voice, messaging and other at TZS 565.2 billion.
M-Pesa revenue grew 24.5% from TZS 590.2 billion in FY25 to TZS 734.8 billion in FY26, and M-Pesa users rose 22.6% from 11.5 million to 14.1 million, both measured over the year to March.
Digital loans of TZS 3.4 trillion have been disbursed through Songesha, M-Wekeza has passed TZS 200 billion and the Lipa kwa M-Pesa merchant base grew 35.8% in the December 2025 quarter.
M-Pesa revenue growth accelerated to 26.0% year on year in the quarter to June 2026, after 24.5% over the full FY26.
CRDB Bank Plc
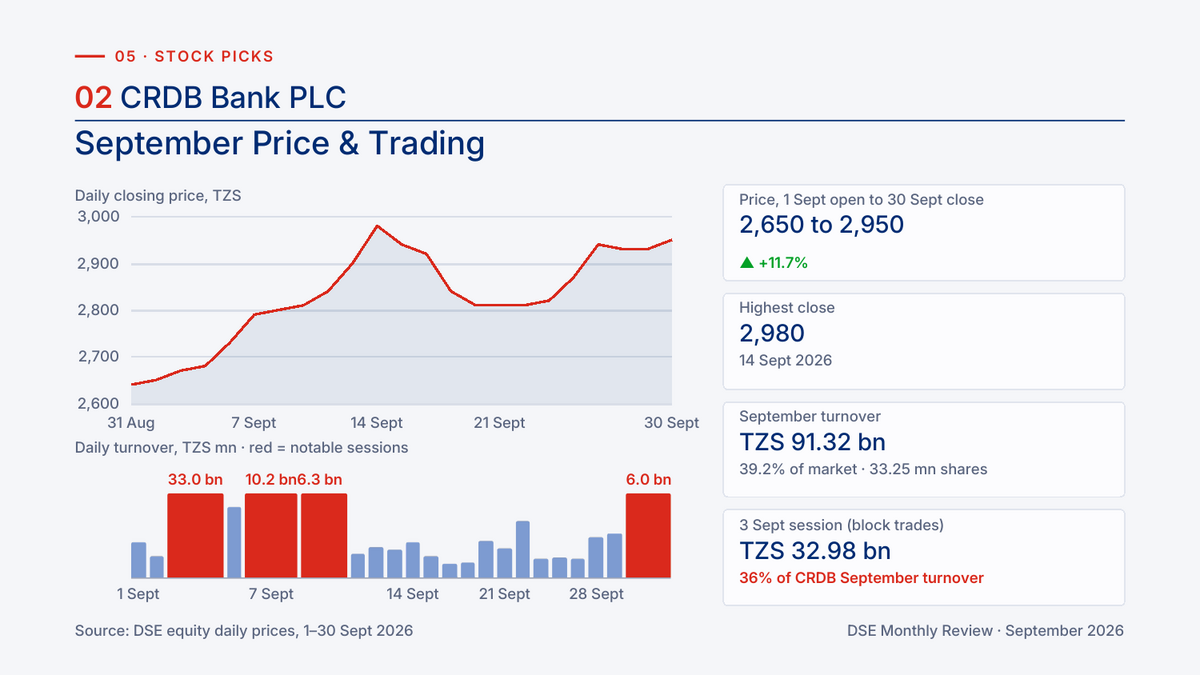
CRDB shares rose 11.3% from TZS 2,650 at the 1 September close to TZS 2,950 at the 30 September close, a gain of 11.7% when measured from the 31 August close of TZS 2,640.
The highest close was TZS 2,980 on 14 September, and September turnover of TZS 91.32 billion, or 39.2% of the market, was traded across 33.25 million shares.
A single block-trade session on 3 September accounted for TZS 32.98 billion, or 36% of CRDB’s September turnover, while turnover on 30 September was TZS 6.04 billion.
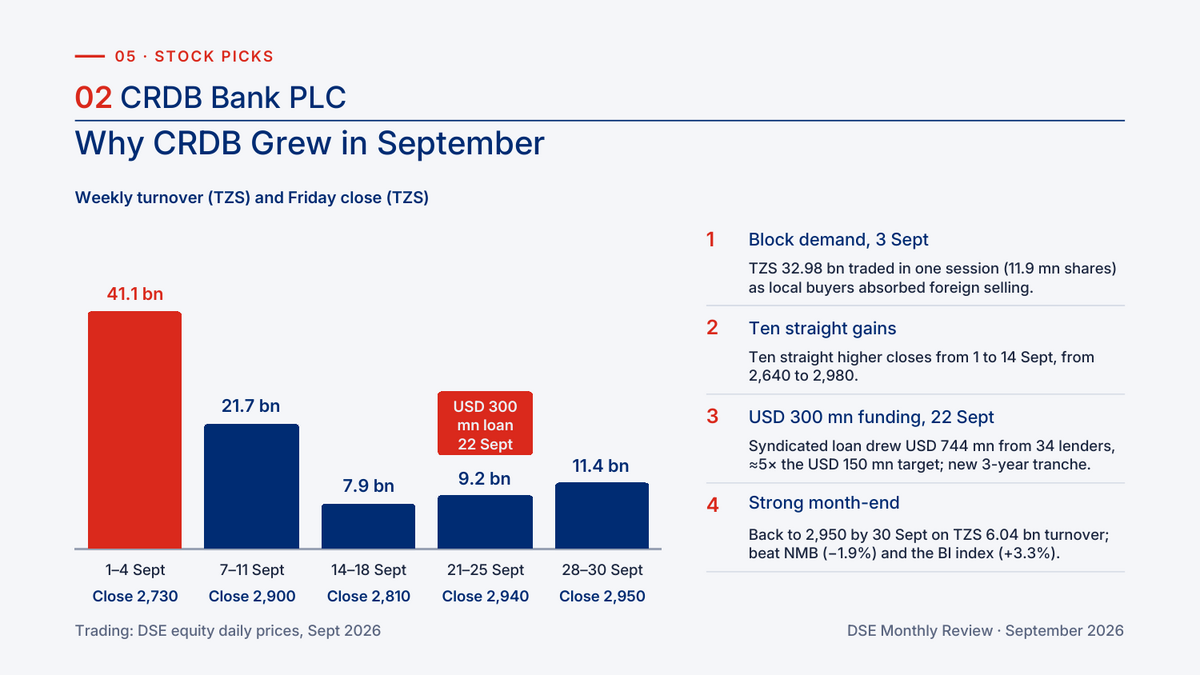
Kadoo points to four drivers behind the rise: block demand on 3 September, ten straight gains, new funding on 22 September and a strong month-end.
The 3 September block session covered 11.9 million shares and was absorbed by local buyers while foreign investors were selling.
CRDB recorded ten straight higher closes from 1 to 14 September, taking the price from TZS 2,640 to TZS 2,980.
CRDB’s USD 300 million funding on 22 September took the form of a syndicated loan that drew USD 744 million from 34 lenders, about five times the USD 150 million target, and added a new three-year tranche.
CRDB returned to TZS 2,950 by 30 September, outperforming NMB, which fell 1.9%, and the Banks, Finance and Investment index, which rose 3.3%.
CRDB weekly turnover fell from TZS 41.1 billion in the first week to TZS 21.7 billion and TZS 7.9 billion in the next two weeks before recovering to TZS 9.2 billion and TZS 11.4 billion.
The weekly closing prices were TZS 2,730, TZS 2,900, TZS 2,810, TZS 2,940 and TZS 2,950 across the five trading weeks of the month.
Afriprise Investment Plc
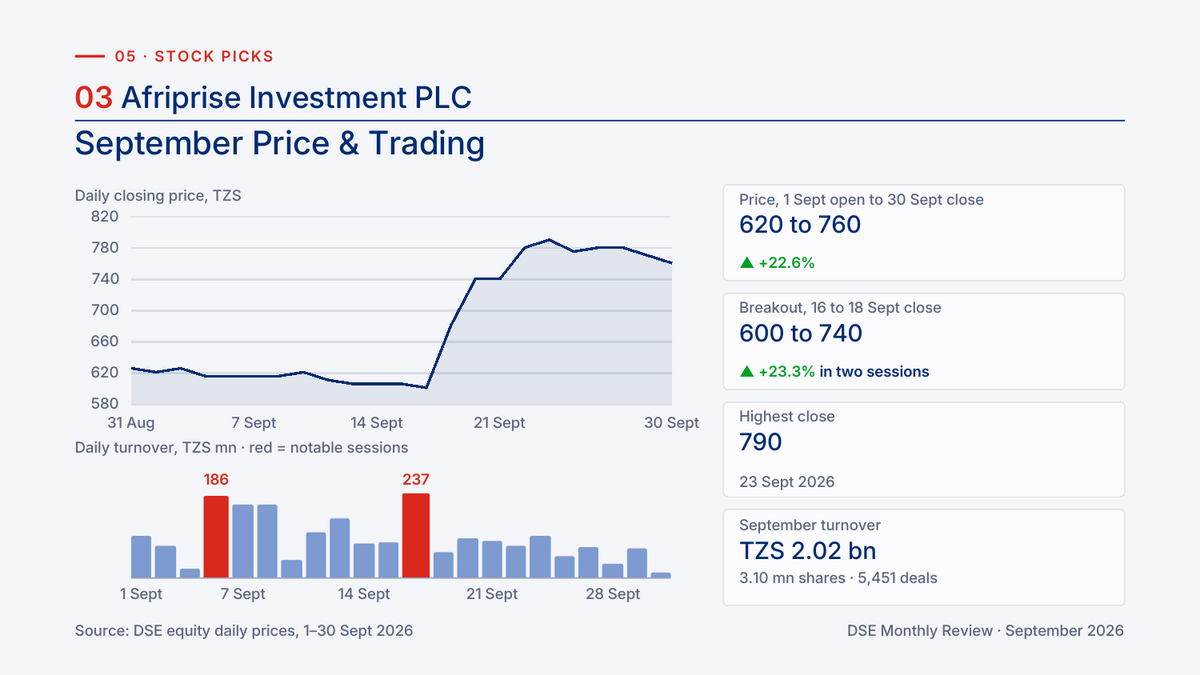
AFRIPRISE shares rose 22.6% from TZS 620 to TZS 760 over the month, the strongest gain of any DSE counter, with a highest close of TZS 790 on 23 September.
A breakout between the 16 and 18 September closes lifted the price 23.3% in two sessions, from TZS 600 to TZS 740.
September turnover was TZS 2.02 billion across 3.10 million shares and 5,451 deals, with two notable sessions of TZS 186 million and TZS 237 million.
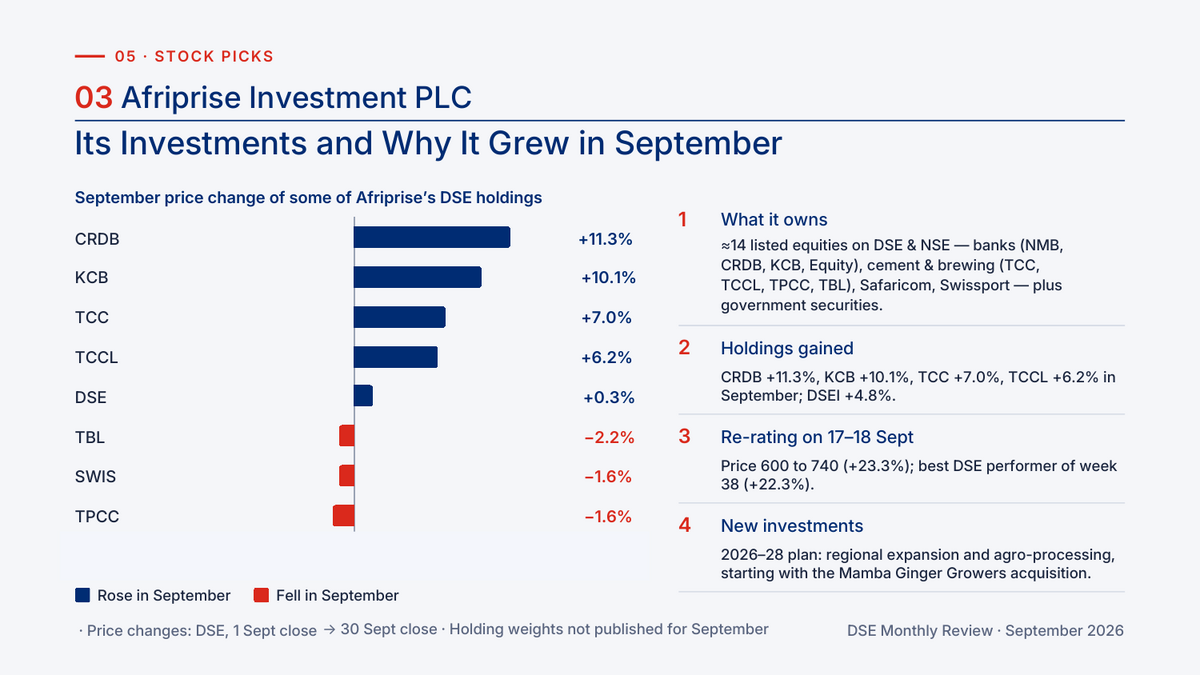
Kadoo explains the September rise through Afriprise’s own holdings, a re-rating on 17 and 18 September and its new investment plan.
Afriprise owns about 14 listed equities on the DSE and the Nairobi Securities Exchange (NSE), including the banks NMB, CRDB, KCB and Equity, the counters TCC, TCCL, TPCC and TBL, Safaricom and Swissport (DSE: SWIS), as well as government securities.
Among its DSE holdings CRDB gained 11.3%, KCB 10.1%, TCC 7.0% and TCCL 6.2% in September, against a 4.82% rise in the All Share Index.
The exchange’s own shares rose 0.3% among those holdings, while TBL fell 2.2% and SWIS and TPCC each fell 1.6% over the month.
The review notes that Afriprise’s holding weights were not published for September, so the price changes are shown without position sizes.
The price re-rated from TZS 600 to TZS 740 on 17 and 18 September, a rise of 23.3%, making Afriprise the best performing DSE counter of week 38 with a gain of 22.3%.
Afriprise’s investment plan for 2026 to 2028 centres on regional expansion and agro-processing, with the acquisition of Mamba Ginger Growers named as the first step.
Investor Flows
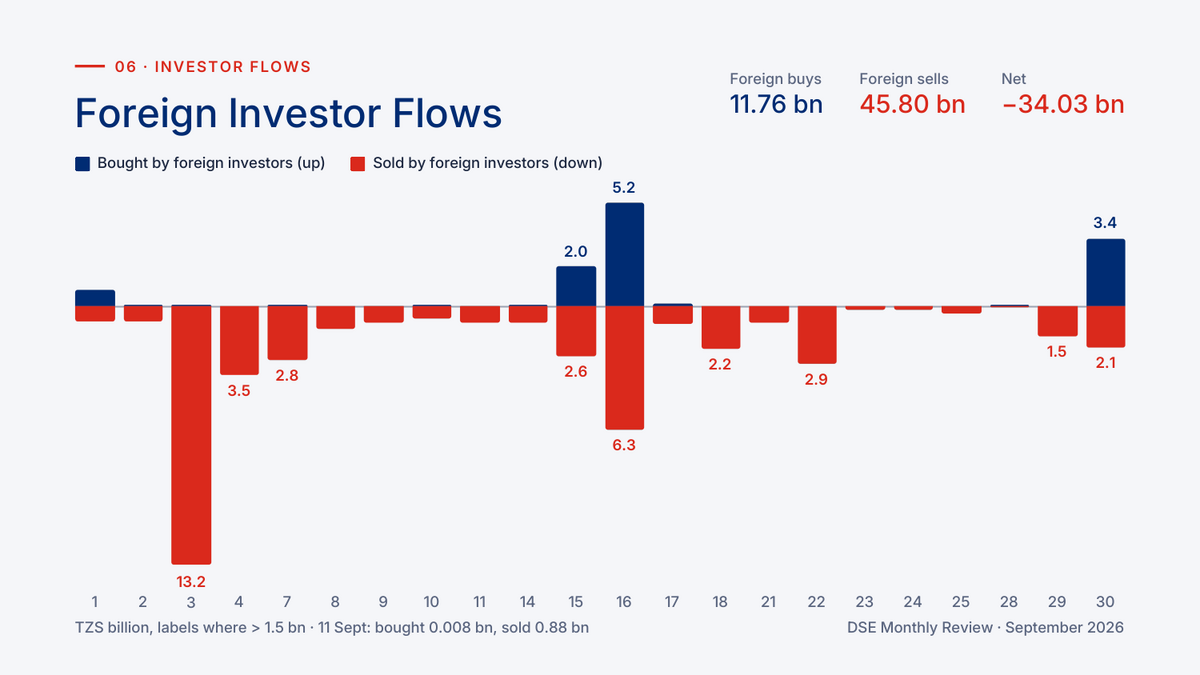
Foreign investors bought TZS 11.76 billion of equities and sold TZS 45.80 billion during September, leaving a net outflow of TZS 34.03 billion over the month.
The largest day of foreign selling was 3 September at TZS 13.2 billion, the session of the CRDB block trade, with further sales of TZS 3.5 billion on 4 September and TZS 2.8 billion on 7 September.
Foreign buying was most visible on 15, 16 and 30 September, when foreign investors bought TZS 2.0 billion, TZS 5.2 billion and TZS 3.4 billion against sales of TZS 2.6 billion, TZS 6.3 billion and TZS 2.1 billion.
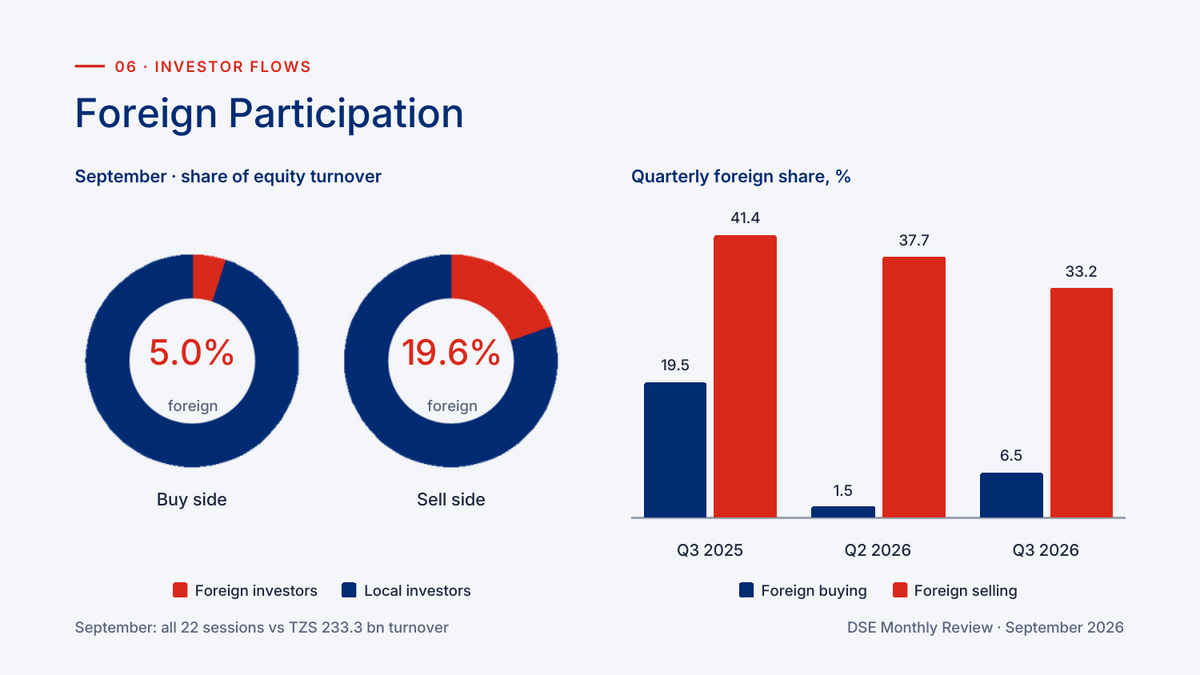
Foreign investors accounted for 5.0% of equity turnover on the buy side and 19.6% on the sell side in September, measured across all 22 sessions against TZS 233.3 billion of turnover.
The foreign share of turnover in the third quarter of 2026 was 6.5% on the buy side and 33.2% on the sell side.
That compares with 1.5% on the buy side and 37.7% on the sell side in the second quarter, and with 19.5% and 41.4% in the third quarter of 2025.
ETFs and Fixed Income
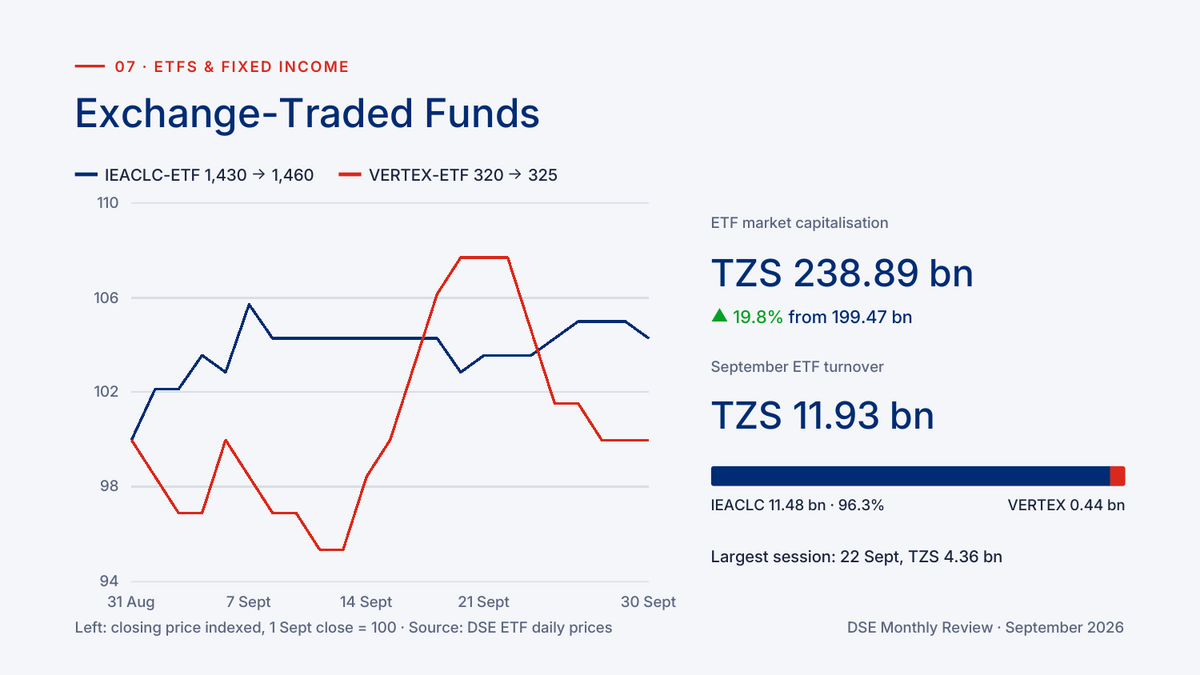
The review tracks two exchange-traded funds, the first being the iTrust East African Community Large Cap Exchange Traded Fund (DSE: IEACLC-ETF), which moved from TZS 1,430 to TZS 1,460 in September.
The second is the Vertex Exchange Traded Fund (DSE: VERTEX-ETF), which moved from TZS 320 to TZS 325 over the same period.
ETF market capitalisation rose 19.76% to TZS 238.89 billion from TZS 199.47 billion at the end of August, and September ETF turnover was TZS 11.93 billion.
IEACLC-ETF accounted for TZS 11.48 billion or 96.3% of ETF turnover and VERTEX-ETF for TZS 0.44 billion, with the largest ETF session on 22 September at TZS 4.36 billion.
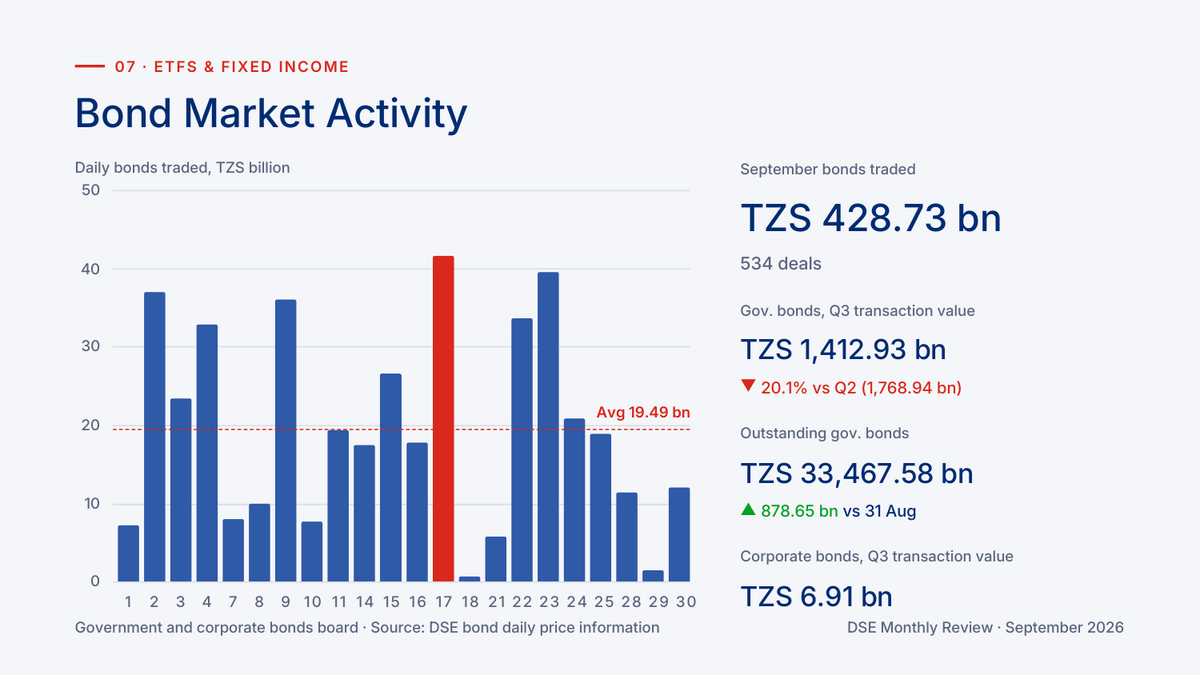
Bonds traded on the exchange totalled TZS 428.73 billion across 534 deals in September, a daily average of TZS 19.49 billion, with the busiest session on 17 September.
Government bond transaction value for the third quarter was TZS 1,412.93 billion, down 20.1% from TZS 1,768.94 billion in the second quarter, while corporate bond transaction value was TZS 6.91 billion.
Outstanding government bonds stood at TZS 33,467.58 billion at 30 September, up TZS 878.65 billion from 31 August, while outstanding corporate bonds were unchanged at TZS 513.15 billion.
Key Market Indicators
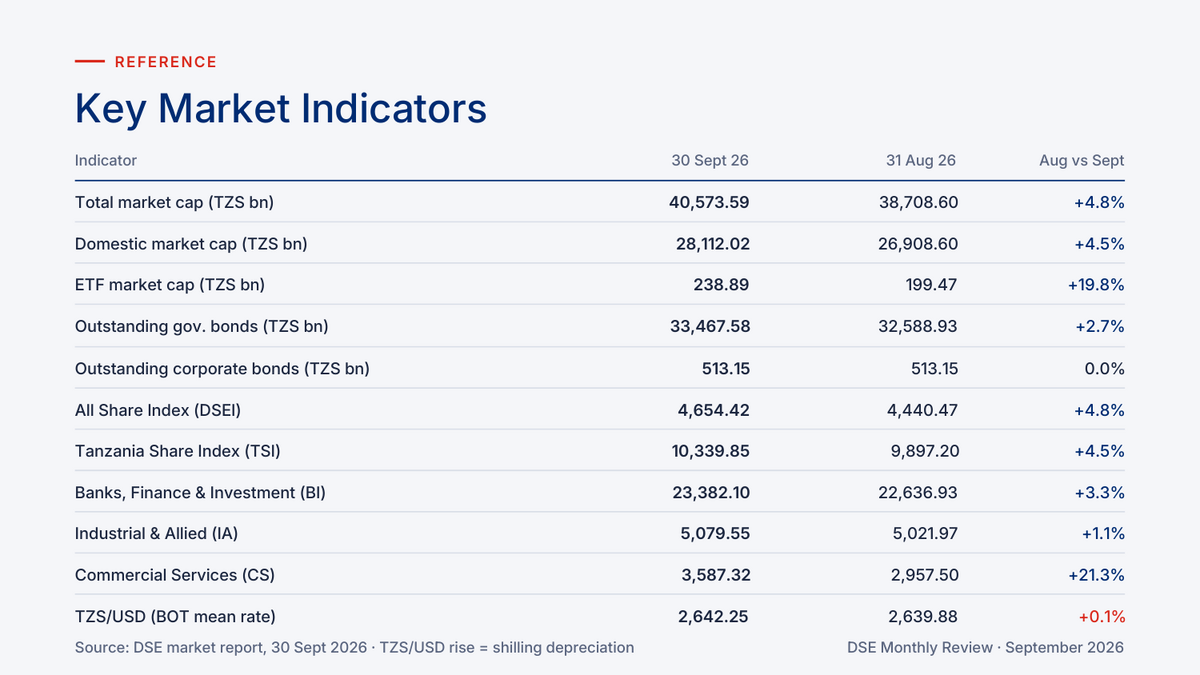
The reference table compares 30 September with 31 August 2026, showing total market capitalisation up 4.82% from TZS 38,708.60 billion to TZS 40,573.59 billion and domestic market capitalisation up 4.5% from TZS 26,908.60 billion to TZS 28,112.02 billion.
The Bank of Tanzania mean exchange rate was TZS 2,642.25 per US dollar at 30 September against TZS 2,639.88 at 31 August, a rise of 0.1% that reflects a slight depreciation of the shilling.
September in Summary
Kadoo’s summary of the month highlights four points: indices up close to 5%, liquidity concentrated in two banks, foreign investors as net sellers, and Commercial Services and ETFs leading the market.
The All Share Index rose 4.82% and the Tanzania Share Index 4.47%, after a mid-month peak on 15 September and a mild pull-back.
NMB and CRDB made up 81.3% of equity turnover, and 57% of the TZS 233.3 billion traded changed hands in the first two weeks of the month.
Foreign investors were net sellers with an outflow of TZS 34.03 billion that local investors absorbed, and the third-quarter foreign selling share eased to 33.2%.
The Commercial Services index rose 21.30% as VODA gained 22.9% on the summary’s measure, against 21.7% from the 1 September close, while ETF market capitalisation rose 19.76% to TZS 238.89 billion.
Download the Report
The complete Dar es Salaam Stock Exchange Market Review for September 2026 by Kadoo Securities, including all charts and data tables, is available to download here.
Disclaimer
This report was prepared by Kadoo Securities Co. Limited for general information and research purposes only, and does not constitute investment, legal, tax or accounting advice or a solicitation to buy, sell or hold any security. Kadoo Securities Research obtained the information from sources it considers reliable but does not guarantee its accuracy, completeness or timeliness.
Kadoo Securities Co. Limited
Website: kadoosecurities.co.tz
General inquiries: info@kadoosecurities.co.tz
Telephone: +255 763 889 000, +255 765 152 031
Research Department
Erick Sindatuma, Analyst
Email: ericksindatuma@kadoosecurities.co.tz
WhatsApp: +255 769 904 379
Want to know more about Capital Markets in Tanzania? Our upcoming Capital Markets Guide covers the Dar es Salaam Stock Exchange (DSE), listed companies, bonds, and private equity, plus the regulatory framework for investing in Tanzania’s capital markets.
Learn MoreWant to know more about the Capital Markets in Tanzania? Our free overview of the Tanzania Business and Investment Guide 2026 covers the Capital Markets, plus key sectors and investment opportunities. The complete 141-page edition includes policies, taxation, key regulations, full macroeconomic data, and sources, and is also available at no cost upon completion of a short form.
Download Free OverviewGet the Full Edition for Free