Economy
Tanzania is East Africa's second-largest economy at USD 78.84 billion in 2024 and the 10th largest in Africa, with GDP growth estimated at 5.9% in 2025, FDI inflows up 28.3% to USD 1.72 billion, inflation at 3.3%, and public debt at 40.6% of GDP—well below the 55% sustainability threshold.
The Bank of Tanzania, IMF, and World Bank project growth above 6% for 2026 and 2027, supported by large-scale Investment in railways, roads, airports, agriculture, mining, and sports facilities tied to AFCON 2027 co-hosting.
Major projects anchoring this trajectory include the Standard Gauge Railway connecting Dar es Salaam to Dodoma and onward to Mwanza, the East African Crude Oil Pipeline (EACOP) terminating at Tanga Port, the USD 42 billion Likong'o-Mchinga LNG project with a final investment decision targeted for 2026, the 2,115 MW Julius Nyerere Hydropower Plant now fully commissioned, and the new Msalato International Airport in Dodoma.
Tanzania reached lower-middle-income status in 2020 and now targets upper-middle-income status by 2050 under Vision 2050 (Dira 2050), with a GNI per capita above USD 4,516 driven by nine priority transformation sectors and the execution of FYDP IV.
The population of approximately 70 million is growing at 3.2% per year and is projected to reach 123.4 million by 2044, with 42.8% under 14 years and 19.2% aged 15-24—providing a substantial youth labor force and consumer base.
Governance is anchored in multi-party democracy with the 2025 elections returning President Samia Suluhu Hassan for a second term through 2030; CCM holds 270 of 272 directly elected parliamentary seats alongside ACT-Wazalendo (8) and CHAUMMA (3).
GDP and Sector Composition
Tanzania's GDP at current prices reached USD 78.84 billion in 2024[2], ranking second in East Africa after Kenya (USD 120.34 billion) and 10th in Africa.
GDP for the first three quarters of 2025 was TZS 167.6 trillion (~USD 64.9 billion)[12], with growth of 6.0% compared with 5.5% a year earlier; full-year 2025 growth is estimated at 5.9%[3].
Average annual GDP growth over the past decade reached 5.8%[1]; BOT projects H2 2025/26 growth above 6%[13], the IMF projects 6.3% in 2026 and 6.5% in 2027[4], and the World Bank forecasts 5.9% in 2026 and 6.1% in 2027[11].
Sector composition in Q3 2025—services 36.0%, industry and construction 32.1%, agriculture 24.6%, taxes on products 7.3%; main contributing sectors include agriculture, construction, finance, mining, manufacturing, tourism, trade, and transport.
Gross National Income per capita reached USD 1,210 in 2024[10]; the upper-middle-income target under Dira 2050 is GNI per capita above USD 4,516.
Inflation and Monetary Policy
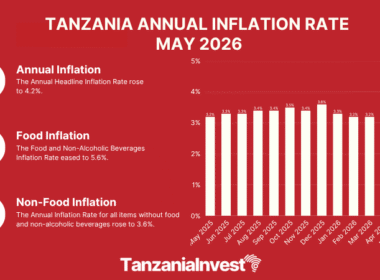
Inflation averaged 3.3% in 2025[8]—the lowest in the region against Kenya 3.9% and Uganda 3.6%[9]—and is forecast to remain within the 3-5% medium-term target[3], consistent with EAC (max 8%) and SADC (3-7%) convergence criteria.
Food inflation rose from 2.1% to 6.4%, non-food inflation declined from 3.5% to 2.0%, core inflation decreased from 3.4% to 2.2%, while non-core inflation rose from 2.2% to 6.2%[14].
BOT introduced the Central Bank Rate (CBR) in January 2024 at 5.5%, raised it to 6.0% in Q2 2024, lowered it to 5.75% in Q3 2025, and maintained it at 5.75% for Q1 2026.
Broad money supply (M3) grew 25.8% YoY in 2025 to TZS 61,524.3 billion[15]; bank credit to private sector expanded 17.6%, led by mining (+91.1%), trade (+49.7%), and agriculture (+28.9%).
The overall lending rate stood at 15.24% in December 2025 with the deposit rate at 8.36%; the Tanzanian shilling averaged TZS 2,452.76 per USD in December 2025 (-1.3% YoY), and foreign reserves reached USD 6,329 million (4.9 months of import cover, exceeding the EAC benchmark of 4.5 months).
Public Debt and Fiscal Performance
Central Government Debt Stock reached TZS 109,441.30 billion (USD 41,642.51 million) as of end-June 2025[3], up 12.96% from TZS 96,884.18 billion a year earlier; external debt represents 67.56% of the total at TZS 73,938.51 billion and domestic debt 32.44% at TZS 35,502.78 billion.
National debt stock reached USD 50,794.2 million by end-2025, with external debt at 69.5% and multilateral institutions accounting for 58.2% of external debt.
Public debt to GDP (net present value) declined to 40.6% from 41.1%—well below the 55% sustainability threshold—and BOT classifies risk of distress as moderate.
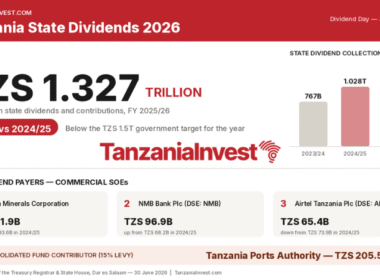
Total domestic revenue for FY 2024/25 reached TZS 34,845.9 billion (100.7% of target, +16.8% YoY)[16]; total grants reached TZS 880.1 billion (111% of target); Government spending was TZS 49,362.28 billion (98% of target), with Development Expenditure at TZS 15,402.72 billion (31.2%, 100.3% of target).
Tax Revenue and Budget
The Tanzania Revenue Authority collected TZS 30,095.7 billion in FY 2024/25, accounting for 86.4% of total domestic revenue[16], with MDAs contributing TZS 3,312.9 billion (9.5%) and LGAs TZS 1,437.3 billion (4.1%).
Major tax instruments include corporate income tax, individual income tax, VAT, excise duties, customs duties, withholding taxes, and royalties and levies across mining and other extractives.
The Finance Act 2025 introduced the 0.1% HIV Response Levy on gross mineral value and a mandatory inbound travel insurance premium of approximately USD 44 for non-EAC/SADC foreign visitors.
The Presidential Commission for Tax Assessment and Advisory, launched October 2024, submitted 284 recommendations in March 2026 spanning policy, legislation, ICT, administration, formalization, dispute resolution, and tax management—with a flagship proposal to develop a National Tax Policy.
The National Budget 2025/26 emphasizes development expenditure, infrastructure, AFCON 2027 financing, and continued industrialization investments; VAT applies at the standard rate with sector-specific exemptions, including the 2023 tax removal on low-cost housing below TZS 50 million.
Foreign Direct Investment
FDI inflows rose from USD 1.339 billion in 2023 to USD 1.718 billion in 2024 (+28.3%)[5], continuing recovery from the Covid-19 slowdown of 2020.
In 2023, mining and quarrying, manufacturing, finance and insurance, and information and communication captured 82.4% of total FDI[17]; inflows to information and communication more than doubled to USD 198 million driven by demand for internet services and mobile money.
Leading 2023 source countries were Mauritius, Australia, the United Kingdom, Barbados, the Netherlands, and South Africa, with the top 10 countries accounting for 64.7% of total FDI.
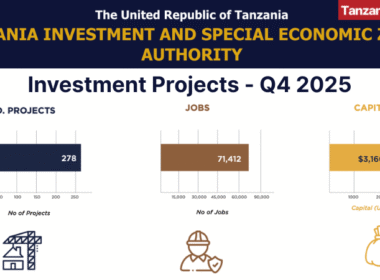
TISEZA recorded 915 new Investment projects in 2025 worth USD 10.95 billion[18]; in Q1 FY 2025/26, manufacturing, commercial buildings, transportation, tourism, and agriculture attracted the most projects[19].
Top five FDI sources in 2025 were the UAE, China, India, Singapore, and France.
Employment and Jobs
The working-age population reached 37.2 million in 2024 with a Labor Force Participation Rate of 73.2%[20]; youth aged 15-24 number 11.4 million (30.6% of working-age population) with an LFPR of 60.3% against 70.6% for 15-35 and 76.4% for 36+.
Persons with disabilities show only 54.4% labor force participation; the official unemployment rate is 6.2%, with female unemployment at 7.5% versus male 4.9% and youth (15-24) unemployment at 10.0%.
Approximately 700,000 new young Tanzanians enter the job market each year[21], with average hours worked at 39 per week.
The private sector employs 27.5 million formal workers; informal employment rose from 92.5% in 2020/21 to 94.6% in 2024.
Sector employment shares in 2024—agriculture 54.2% (down from 60.4%), services 35.5% (up from 30.3%), industry 10.3% (up from 9.3%); average monthly income reached TZS 477,241 (USD 184), with urban earnings at TZS 586,213 (USD 226) and rural at TZS 328,136 (USD 127).
Population and Demographics
The 2022 Population and Housing Census recorded 62.7 million, with the current estimate around 70 million[6]; the population growth rate of 3.2% per year (up from 2.7% in 2002-2012) implies a doubling to approximately 123.4 million by 2044.
96.9% live on the mainland and 3.1% in Zanzibar, with 48.7% male and 51.3% female; the population is predominantly young, with 42.8% aged 0-14 and 19.2% aged 15-24.
Adult literacy rose from 71.8% in 2012 to 83.0% in 2022, with males at 86.8% and females at 79.5%.
Tanzania hosts over 120 ethnic groups predominantly of Bantu origin, with the Sukuma (~16% / 10 million), Nyamwezi, Chagga, and Haya as the largest; religion is split nearly evenly between Christianity and Islam, and Swahili serves as the unifying national language widely spoken across East Africa.
Governance and Political System
Tanzania is a unitary presidential constitutional republic formed in 1964 through the union of Tanganyika and Zanzibar, with political stability and continuity of governance since independence in 1961.
The multiparty electoral system comprises 22 political parties, and the President—Head of State and Head of Government—is elected for a maximum of two five-year terms; the central Government has three main organs: President and Cabinet, Judiciary, and Parliament (Bunge).
In the 2025 general elections, ruling Chama Cha Mapinduzi (CCM) won 270 of 272 directly elected seats; CHADEMA was disqualified, while ACT-Wazalendo holds 8 seats and CHAUMMA 3[7].
President Samia Suluhu Hassan—the first woman to hold the presidency—assumed office on March 19, 2021 after the death of John Magufuli and won the 2025 elections for a second term through 2030; Zanzibar retains semi-autonomous status with President Hussein Mwinyi (CCM) re-elected in 2025.
Anti-Corruption commitments span the Universal Health Insurance Act 2023, MKUMBI II Blueprint, the Presidential Commission for Tax Assessment, and digital platforms (GePG, GovESB, TeIW, TeSWS) designed to reduce face-to-face interactions; REPOA and other independent think tanks contribute socioeconomic research informing policy.
National Development Vision
Tanzania Development Vision 2050 (Dira 2050), released July 2025, succeeds Vision 2025 and targets upper-middle-income status by 2050 (GNI per capita above USD 4,516).
Implementation rests on three pillars—economic transformation and competitiveness, social progress, and institutional and governance modernization—and nine priority transformation sectors: agriculture, tourism, manufacturing, construction and real estate, mining, blue economy, sports and creative industries, financial sector, and services sector.
FYDP IV is the first medium-term plan implementing Dira 2050, with an average annual manufacturing growth target of 9% and a 15% sectoral GDP share by 2031, positioning Tanzania as the leading manufacturing hub in the EAC.
Public-Private Partnership delivery is central, with examples including Kilimanjaro International Airport (management contract) and Kigamboni Bridge (joint venture); the Blueprint for Regulatory Reforms (MKUMBI 2018) abolished or reduced 374 fees and charges between 2017/18 and 2022/23[23].
MKUMBI II consultations in June 2025 engaged 2,034 individuals, 248 Government institutions, 465 private sector organizations, and 5,453 online respondents; the March 2026 workshop proposed 246 actions across six clusters—regulatory simplification, digital transformation, financial reforms, infrastructure, dispute resolution, and institutional coordination.
Visa, Immigration, and Investment Climate
The Immigration Services Department handles entry and residence permits, with Investment-related applications routed through TISEZA's Tanzania Electronic Investment Window (TeIW) since 2023.
Visa categories include ordinary tourist, business, multiple-entry, and transit visas—most issued through the e-Visa portal—while EAC and SADC nationals benefit from visa-free or simplified arrangements; Tanzanian Embassies and consulates worldwide provide consular, business, and trade promotion services.
Investment incentives are administered through TISEZA across fiscal and non-fiscal measures for SEZ/EPZ projects, while AfDB, IFC, IMF, and World Bank engagement underpins macroeconomic policy and project finance.
SMEs contribute about one-third of GDP and up to 40% of total employment[22], though financing access remains a structural challenge.
The Financial System Stability Index improved to 0.3 in June 2025 from 0.2, NPLs stood at 3.3% of gross loans (below the 5.0% tolerable limit), and foreign reserves of USD 6,329 million (4.9 months import cover) provide a robust buffer against external shocks.
Policies
Tanzania Development Vision 2050 (Dira 2050), released July 2025, anchors policy with three pillars—economic transformation, social progress, and institutional modernization—nine priority sectors, and an upper-middle-income target by 2050; FYDP IV is its first medium-term execution strategy, targeting 9% annual manufacturing growth and a 15% GDP share by 2031.
The Blueprint for Regulatory Reform (MKUMBI 2018) reduced or abolished 374 business fees and charges between 2017/18 and 2022/23, while MKUMBI II (March 2026) proposes 246 actions across regulatory simplification, digital transformation, financial reforms, infrastructure, dispute resolution, and institutional coordination.
The Financial Sector Development Master Plan 2020/21-2029/30 sets nine strategic priorities anchoring banking, capital markets, insurance, and microfinance reforms, complemented by the National Financial Inclusion Framework (NFIF 2023-2028) with interventions targeting women, youth, MSMEs, smallholder farmers, and persons with disabilities.
The Presidential Commission for Tax Assessment and Advisory submitted 284 recommendations in March 2026, proposing a National Tax Policy and reforms across legislation, ICT, administration, formalization, and dispute resolution; the 4Rs philosophy (Reconciliation, Resilience, Reforms, Rebuilding) under President Samia Suluhu Hassan emphasizes consistency, transparency, and predictability for Investment.
The Bank of Tanzania has operated an interest rate-based monetary policy framework since 2024 with the CBR at 5.75% for Q1 2026, alongside a floating exchange rate regime with periodic IFEM interventions; the PPP Policy enables private capital participation through DBFOM, BOT, and joint venture models, with 2023 amendments creating a more enabling environment, while the Universal Health Insurance Act 2023 and Finance Act 2025 expand social protection and Investment competitiveness.
Investment Opportunities
Macroeconomic stability—GDP growth above 6%, inflation within target, prudent debt at 40.6% of GDP, robust foreign reserves of USD 6,329 million, and a depreciation-resistant shilling—provides a foundation for long-term investment across Vision 2050's nine priority sectors: agriculture, tourism, manufacturing, construction and real estate, mining, blue economy, sports and creative industries, financial services, and broader services.
FDI inflows rose 28.3% to USD 1.72 billion in 2024, with 915 new projects worth USD 10.95 billion registered in 2025 and the UAE, China, India, Singapore, and France emerging as leading new-investor sources.
Public-Private Partnerships—refined through 2023 framework amendments—are increasingly central to infrastructure delivery, while incentives span 34 registered Special Economic Zones and 31 privately owned Industrial Parks suited to export-oriented manufacturing and logistics.
Tax simplification under the proposed National Tax Policy and MKUMBI II reforms is lowering compliance costs and improving dispute resolution, while integrated digital platforms streamline applications, payments, and inter-agency exchange, and e-Visa channels enable rapid issuance for business and tourist travel.
SMEs and MSMEs—one-third of GDP and 40% of employment—offer entry points in financing, advisory, digital tools, and value-chain integration, with bank credit to the private sector expanding 17.6% in 2025, led by mining (+91.1%), trade (+49.7%), and agriculture (+28.9%).
Multilateral and bilateral finance from AfDB, IFC, IMF, and the World Bank supports project finance, technical assistance, and policy reforms across sectors, opening co-investment and concessional funding channels for large-scale ventures.
Last Update: May 2026
References
- https://www.bot.go.tz/Publications/Regular/Annual%20Report/en/2026022607584561.pdf (Guide reference #1)
- https://data.worldbank.org/indicator/NY.GDP.MKTP.CD?locations=TZ (Guide reference #2)
- https://www.bot.go.tz/Publications/Regular/Monetary%20policy%20report/en/2026011919182725.pdf (Guide reference #3)
- https://www.imf.org/external/datamapper/NGDP_RPCH@WEO/TZA/CHN (Guide reference #4)
- https://unctad.org/system/files/official-document/wir2025_en.pdf (Guide reference #5)
- https://www.nbs.go.tz/uploads/statistics/documents/sw-1738321655-01.%20URT_Demographic%20and%20Socioeconomic%20Profile.pdf (Guide reference #8)
- https://www.parliament.go.tz/uploads/documents/en-1769678706-ORODHA%20YA%20WABUNGE%20TOLEO%20LA%20KWANZA%20-%2028%20JANUARI,%202026.pdf (Guide reference #9)
- https://www.nbs.go.tz/uploads/statistics/documents/en-1767868197-CPI%20Summary_122025.xls (Guide reference #10)
- https://www.nbs.go.tz/uploads/statistics/documents/en-1767868348-Inflation%20Rates%20for%20%20Neighboring%20Countries_122025.pdf (Guide reference #11)
- https://data.worldbank.org/indicator/NY.GNP.PCAP.CD?locations=TZ (Guide reference #13)
- https://thedocs.worldbank.org/en/doc/bae48ff2fefc5a869546775b3f010735-0500062021/related/mpo-tza.pdf (Guide reference #21)
- https://www.bot.go.tz/Publications/Regular/Quarterly%20statistical%20Bulletin/en/2026022607540099.pdf (Guide reference #46)
- https://www.bot.go.tz/Publications/Regular/Monetary%20Policy%20Statement/en/2026020710260034.pdf (Guide reference #47)
- https://www.nbs.go.tz/uploads/statistics/documents/en-1767868071-CPI%20%20Release_122025_English.pdf (Guide reference #48)
- https://www.bot.go.tz/Publications/Regular/Monthly%20Economic%20Review/en/2026021821282158.pdf (Guide reference #49)
- https://www.mof.go.tz/uploads/documents/en-1759253260-BER%20Q4%202024-25%20as%20Sep.pdf (Guide reference #50)
- https://www.bot.go.tz/Publications/Other/Tanzania%20Investment/en/2025022811524146.pdf (Guide reference #51)
- https://www.tiseza.go.tz/news/investment-trend-in-tanzania-2021-2025 (Guide reference #52)
- https://www.tiseza.go.tz/uploads/documents/en-1765102868-Q1-BULLETIN%20JULY%20TO%20SEPT%20_compressed.pdf (Guide reference #53)
- https://www.nbs.go.tz/uploads/statistics/documents/en-1762517636-THE%20LABOUR%20MARKET%20KEY%20FINDINGS%20FROM%20THE%20ILFS%202024.pdf (Guide reference #54)
- https://www.ulandssekretariatet.dk/wp-content/uploads/2024/10/Tanzania-LMP-2024-final1.pdf (Guide reference #55)
- https://www.mof.go.tz/uploads/documents/en-1731921878-Final_FSDD%20ESMS_pdf.pdf (Guide reference #120)
- https://www.planninginvestment.go.tz/uploads/documents/sw-1725985287-report%20FINAL.pdf (Guide reference #202)
Want to know more about the Economy in Tanzania? Our free overview of the Tanzania Business and Investment Guide 2026 covers the Economy, plus key sectors and investment opportunities. The complete 141-page edition includes policies, taxation, key regulations, full macroeconomic data, and sources.
Download Free OverviewGet the Full Guide