


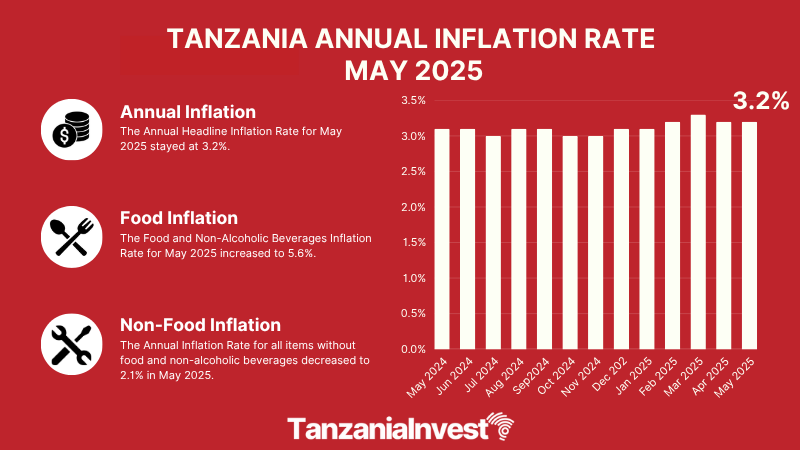
The National Bureau of Statistics of Tanzania (NBS) has announced that the annual headline inflation rate for the year ending May 2025 has stagnated at 3.2% as it was recorded in April 2025.
The overall index went up from 116.18 recorded in May 2024 to 119.85 in May 2025.
Food Inflation
Food and Non-Alcoholic Beverages Inflation Rate for May 2025 has increased to 5.6% from 5.3% that was recorded in April 2025.
Non-Food Inflation
On the other hand, the Annual Inflation Rate for all items without food and non-alcoholic beverages for May 2025 has decreased to 2.1% from 2.3% that was recorded in April 2025.
Core Inflation
The Core Index, which excludes items with volatile prices such as unprocessed food, energy, and utilities (except maize flour), provides a more stable inflation rate for policymakers.
The Core Index includes 297 items with a share of 73.9% of total NCPI weight.
The inflation rate for Core Index in May 2025 has decreased to 2.1% from 2.2% that was recorded in April 2025.
Monthly Consumer Price Index April 2025 – May 2025
The National Consumer Price Index between April 2025 and May 2025 has increased from 119.78 to 119.85%. The increase of the overall index is attributed to price increases for some food and non-food items.
Some food items that contributed to the increase of the index include wheat grains by 2.5%, sorghum grain by 1.0%, finger millet grains by 4.6%, sorghum flour by 1.9%, bread and bakery products by 3.4%, beef meat by 0.3%, dried sardines by 1.9%, dried lentils by 2.5%, dried peas by 0.7%, dried cowpeas by 4.6%, and soft drinks by 0.9%.
Some non-food items that contributed to the increase of the index include footwear for women by 0.2%, products and materials for the maintenance of the dwelling by 0.5%, firewood by 2.8%, household furniture by 0.8%, recreation, sport and culture by 0.1%, food and beverage serving services by 0.2%, and personal care by 0.1%.
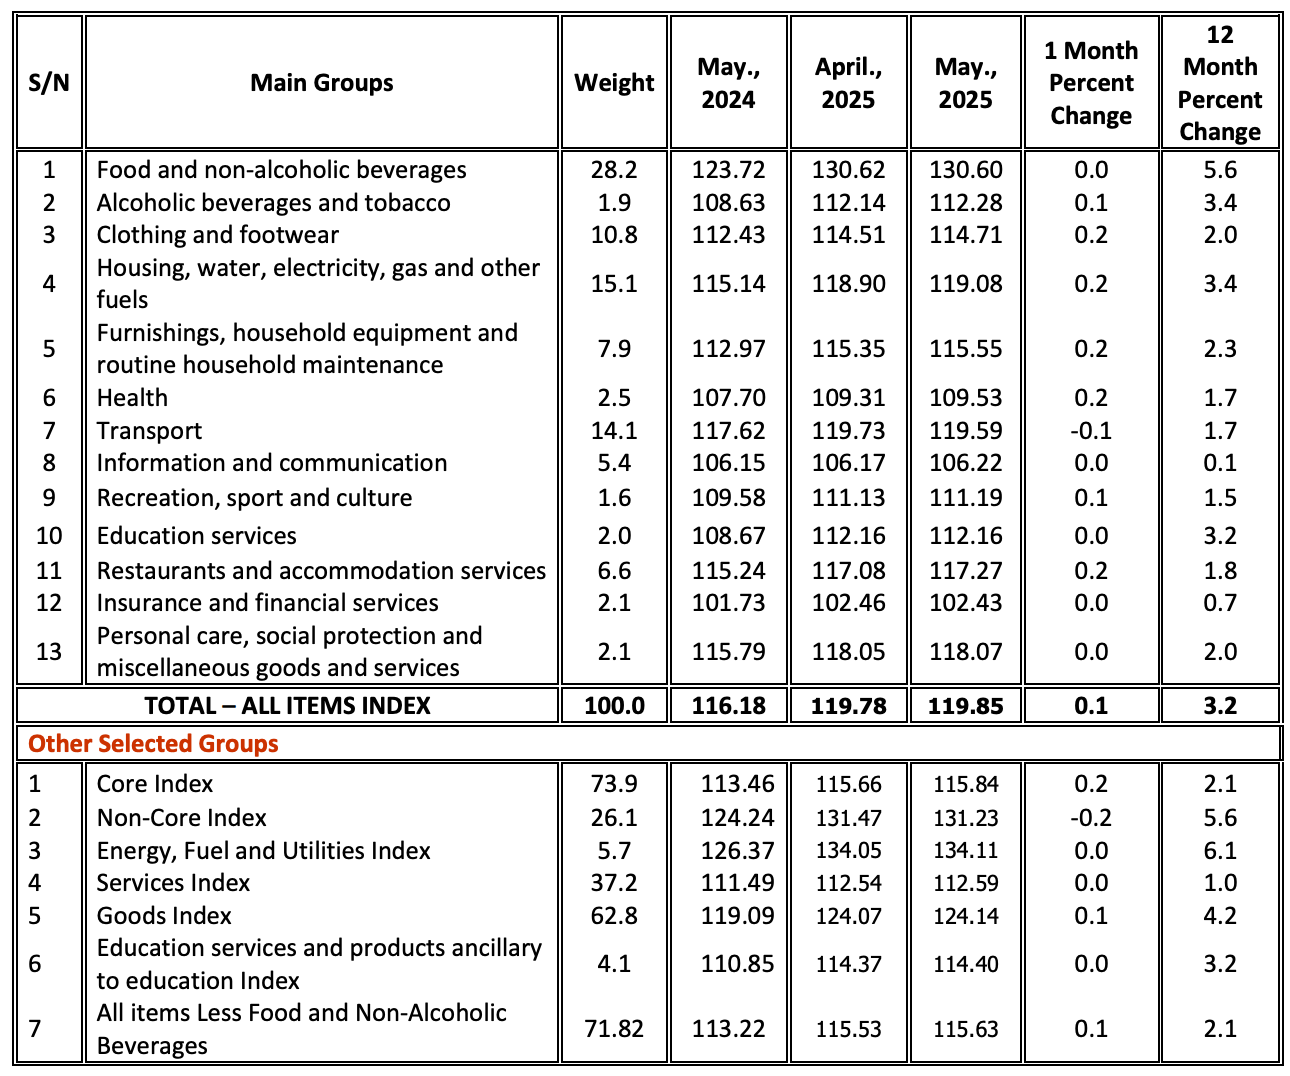
Changes in Tanzania National Consumer Price Indices (NCPI) for May 2025, (2020 = 100)
Want to know more about the Economy in Tanzania? Our free overview of the Tanzania Business and Investment Guide 2026 covers the Economy, plus regulations, key sectors, and investment opportunities. The complete 141-page edition is also available for USD 99.
Download Free OverviewGet the Full Guide — USD 99


