


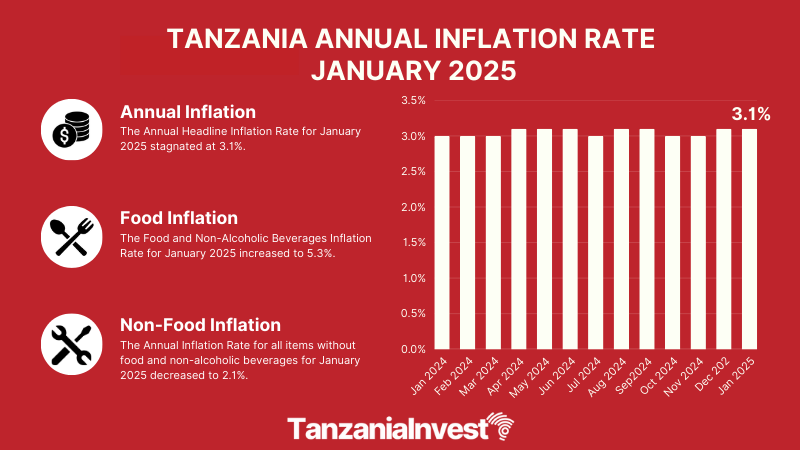
The National Bureau of Statistics of Tanzania (NBS) revealed that the annual headline inflation rate for the year ending January 2025 has stagnated at 3.1 % as it was recorded in December 2024.
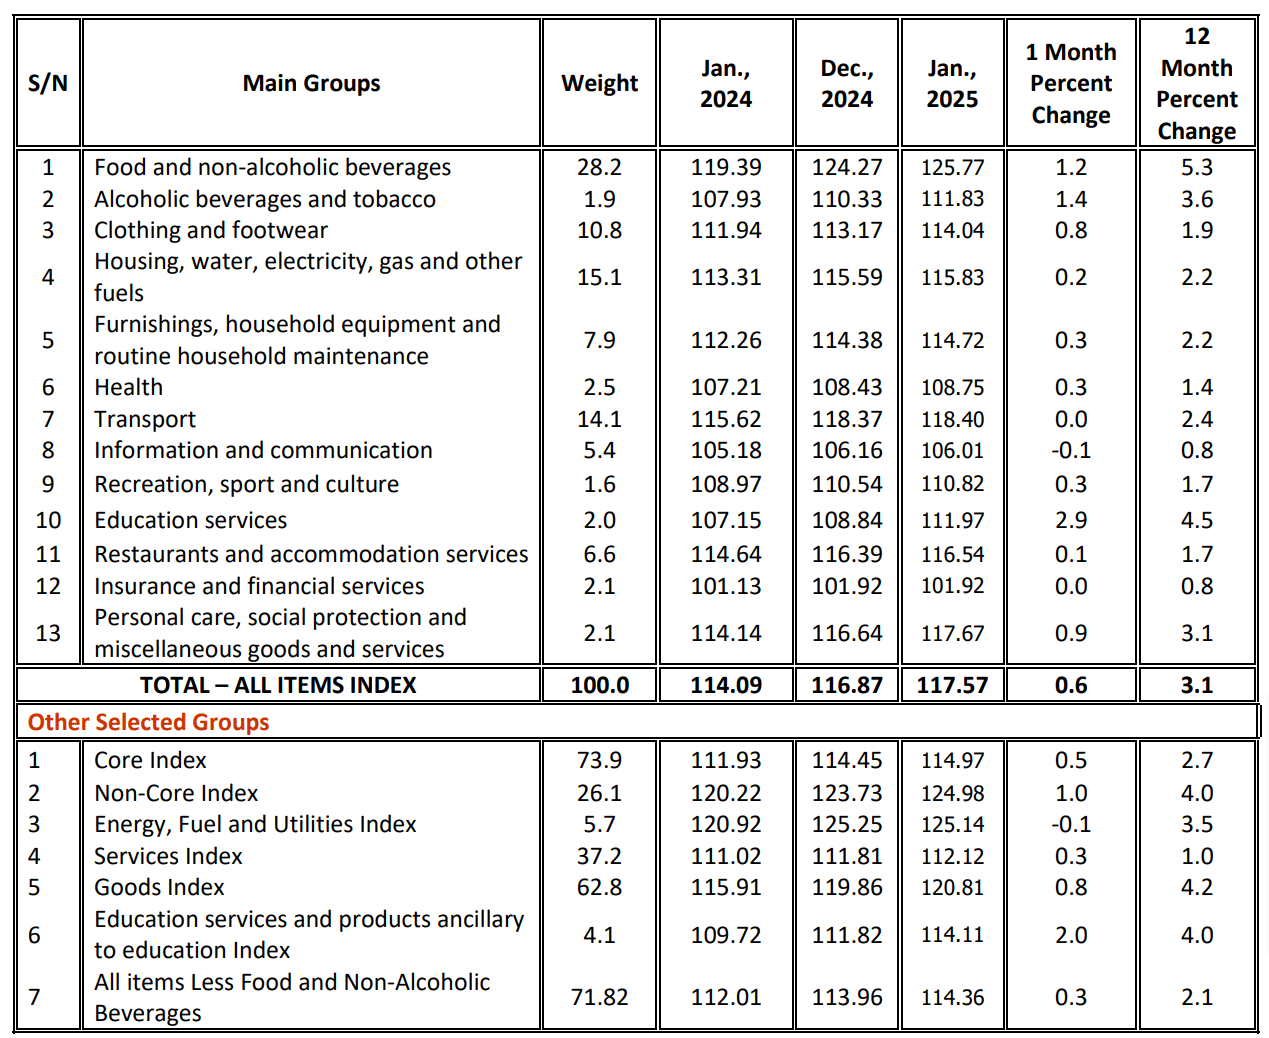
The overall index went up from 114.09 in January 2024 to 117.57 in January 2025.
Food Inflation

The Food and Non-Alcoholic Beverages Inflation Rate for January 2025 increased to 5.3 % from 4.6 % in December 2024.
Non-Food Inflation
On the other hand, the Annual Inflation Rate for all items without food and non-alcoholic beverages for January 2025 has decreased to 2.1 % from 2.5 % which was recorded in December 2024.
Core Inflation
Computation of the Core Index excludes items with volatile prices that are unprocessed food energy and utilities except maize flour.

The exclusion of volatile prices from the total NCPI provides a more stable Inflation Rate figure for policymakers.
The Core Index covers 297 items and the share of weight to total NCPI weight is 73.9 %.
The inflation rate for the Core Index in January 2025 has decreased to 2.7 % from 2.9 % recorded in December 2024.
Monthly Consumer Price Index December 2024 – January 2025
The National Consumer Price Index between December 2024 and January 2025 has increased by 0.6 %.
The increase in the overall index is attributed to price increases for some food and non-food items.
Some food items that contributed to an increase in the index include: – wheat grains by 1.0 % rice by 1.2 % finger millet grains by 8.4 % maize flour by 2.9 % bread and bakery products by 2.1 % traditionally bred live chicken by 3.3 % goat meat by 3.7 % fresh fish by 1.3 % raw milk of cattle by 2.4 % oils and fats by 1.6 % groundnuts by 4.8 % vegetables by 1.7 % sweet potatoes by 4.2 % dried beans by 2.7 % dried lentils by 5.5 % and dry cassava by 3.9 %.
Some Non-Food items that contributed to an increase in the index include: – alcoholic beverages and tobacco by 1.4 % garments for men by 1.3 % school uniforms by 1.9 % firewood by 2.7 % and school fees by 2.9 %.
Changes in Tanzania National Consumer Price Indices (NCPI) for January 2025, (2020 = 100)
Want to know more about the Economy in Tanzania? Our free overview of the Tanzania Business and Investment Guide 2026 covers the Economy, plus key sectors and investment opportunities. The complete 141-page edition includes policies, taxation, key regulations, full macroeconomic data, and sources.
Download Free OverviewGet the Full Guide — USD 99