


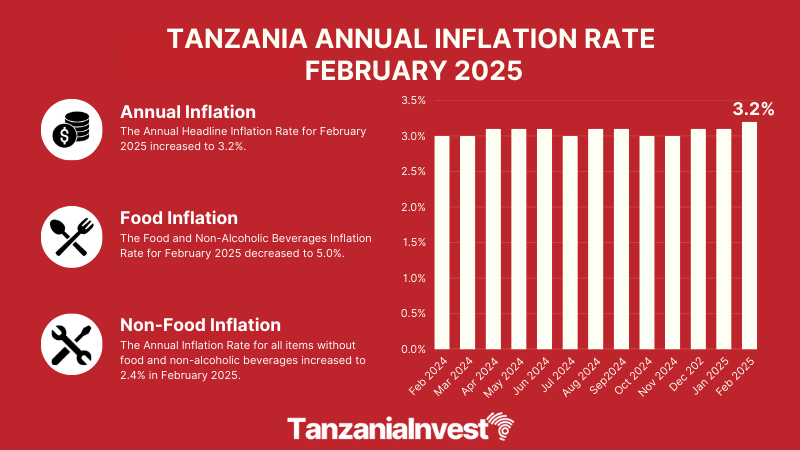
The National Bureau of Statistics of Tanzania (NBS) has announced that the annual headline inflation rate for the year ending February 2025 increased to 3.2%, up from 3.1% recorded in January 2025.
The overall index rose from 114.65 in February 2024 to 118.28 in February 2025.
Food Inflation

The Food and Non-Alcoholic Beverages Inflation Rate for February 2025 decreased to 5.0%, down from 5.3% in January 2025.
Non-Food Inflation
Conversely, the Annual Inflation Rate for all items excluding food and non-alcoholic beverages increased to 2.4% in February 2025, compared to 2.1% in January 2025.
Core Inflation
The Core Index, which excludes items with volatile prices such as unprocessed food, energy, and utilities (except maize flour), provides a more stable inflation rate for policymakers.

The Core Index covers 297 items, representing 73.9% of the total NCPI weight.
The inflation rate for the Core Index in February 2025 decreased to 2.5%, down from 2.7% recorded in January 2025..
Monthly Consumer Price Index January 2025 – February 2025
The National Consumer Price Index between January 2025 and February 2025 increased by 0.6%.
This rise in the overall index is attributed to price increases for some food and non-food items.
Food items that contributed to the increase include rice (3.8%), finger millet grains (10.1%), maize grains (1.8%), sorghum flour (4.0%), maize flour (2.6%), pasta products (1.1%), fresh beef (0.8%), cooking oils (2.4%), fruits (2.6%), groundnuts (4.9%), vegetables (1.3%), round potatoes (2.5%), sweet potatoes (2.9%), dried beans (3.5%), dried lentils (2.0%), cowpeas (3.7%), and cassava flour (1.4%).
Non-food items that contributed to the increase include clothing materials (0.4%), garments for women and children (0.3%), school uniforms (0.2%), kerosene (0.8%), firewood (9.0%), charcoal (0.4%), dental services (3.3%), diesel (0.9%), petrol (0.4%), and education services (0.2%).
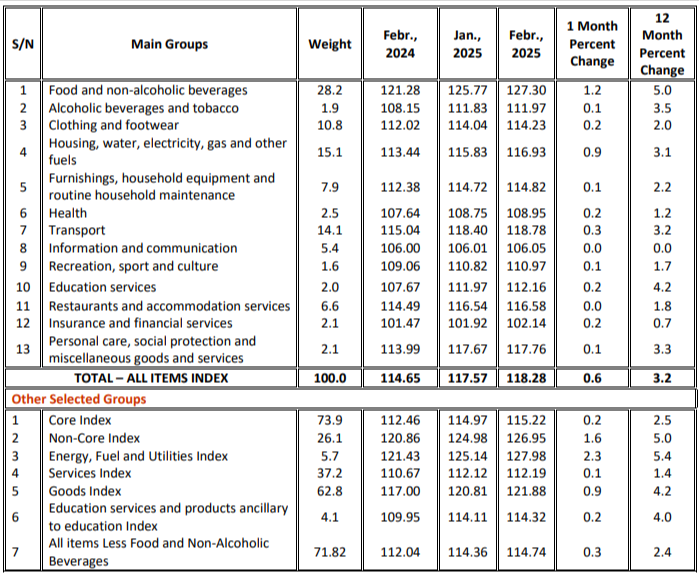
Changes in Tanzania National Consumer Price Indices (NCPI) for February 2025, (2020 = 100)
Want to know more about the Economy in Tanzania? Our free overview of the Tanzania Business and Investment Guide 2026 covers the Economy, plus key sectors and investment opportunities. The complete 141-page edition includes policies, taxation, key regulations, full macroeconomic data, and sources.
Download Free OverviewGet the Full Guide — USD 99