

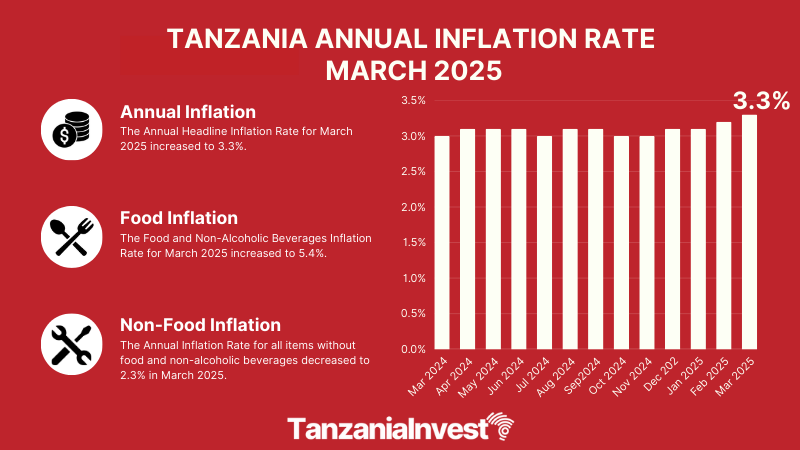
The National Bureau of Statistics of Tanzania (NBS) has announced that the annual headline inflation rate for the year ending March 2025 slightly increased to 3.3% from 3.2% recorded in February 2025.
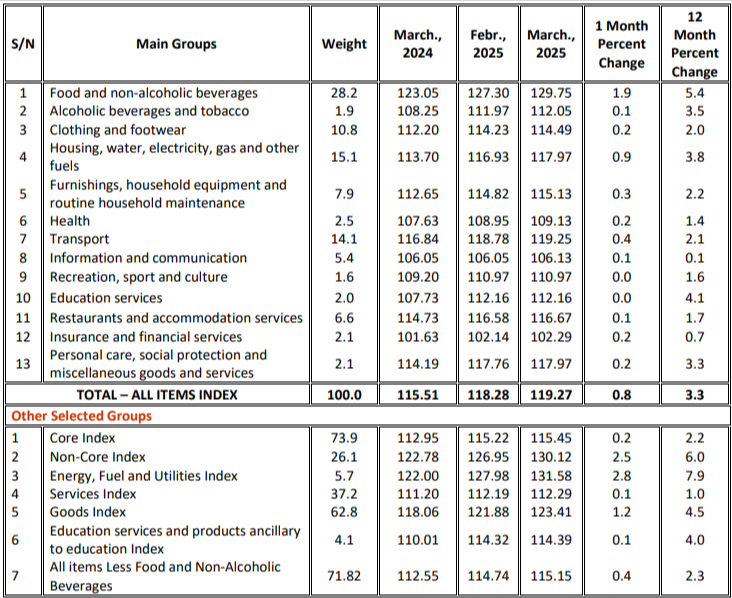
The overall index went up from 115.51 recorded in March 2024 to 119.27 in March 2025.
Food Inflation

The Food and Non-Alcoholic Beverages Inflation Rate for March 2025 has increased to 5.4% from 5.0% in February 2025.
Non-Food Inflation
On the other hand, the Annual Inflation Rate for all items without food and non-alcoholic beverages for March 2025 has decreased to 2.3% from 2.4% in February 2025.
Core Inflation
The Core Index, which excludes items with volatile prices such as unprocessed food, energy, and utilities (except maize flour), provides a more stable inflation rate for policymakers.

The Core Index covers 297 items, representing 73.9% of the total NCPI weight.
The inflation rate for the Core Index in March 2025 has decreased to 2.2% from 2.5% recorded in February 2025.
Monthly Consumer Price Index February 2025 – March 2025
The National Consumer Price Index between February 2025 and March 2025 has increased by 0.8%.
The increase in the overall index is attributed to price increases for some food and non-food items.
Some food items that contributed to an increase of the index include: wheat grains by 1.8%; maize grains by 2.8%; wheat flour by 0.8%; maize flour by 3.9%; bread and bakery products by 3.0%; pasta products by 1.6%; poultry by 5.5%; beef by 0.8%; poultry meat by 0.7%; fresh fish by 4.5%; dried sardines by 1.3%; raw cattle milk by 1.5%; vegetables by 2.8%; round potatoes by 3.2%; sweet potatoes by 3.7%; fresh cassava by 7.3%; cocoyams by 4.9%; cooking bananas by 7.2%; soy beans by 2.2%; dried peas by 9.0% and cassava flour by 2.3%.
Some Non-Food items that contributed to an increase of the index includes: garments for men by 0.4%; footwear for men by 0.5%; footwear for women by 0.2%; products and materials for the maintenance of the dwelling by 0.2%; gas (LPG) by 0.3%; kerosene by 6.3%; furnishings household equipment and routine household maintenance by 0.3%; diesel by 7.4%; petrol by 6.1%; accommodation services in hotels lodges and guest house by 0.8% and goods and services for personal care by 0.5%
Changes in Tanzania National Consumer Price Indices (NCPI) for March 2025, (2020 = 100)
Want to know more about the Economy in Tanzania? Our free overview of the Tanzania Business and Investment Guide 2026 covers the Economy, plus key sectors and investment opportunities. The complete 141-page edition includes policies, taxation, key regulations, full macroeconomic data, and sources.
Download Free OverviewGet the Full Guide — USD 99