

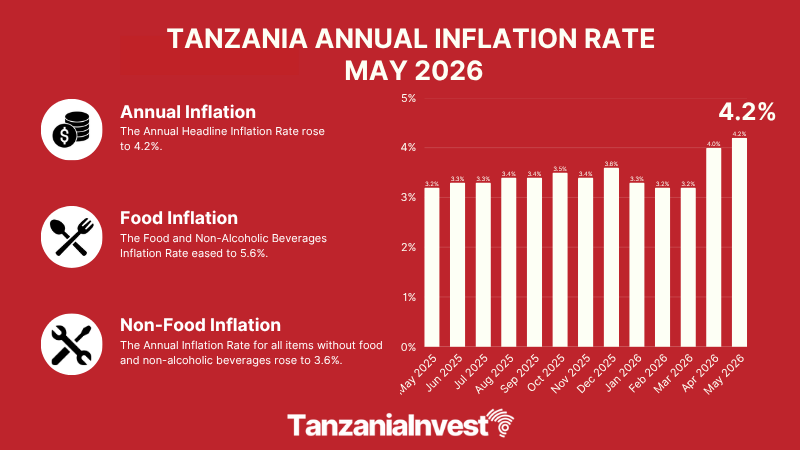
Tanzania’s annual headline inflation accelerated to 4.2% in May 2026, up from 4.0% recorded in April, according to data released on June 8, 2026, by the National Bureau of Statistics (NBS).
The figure is measured by the National Consumer Price Index (NCPI), which tracks price changes across a fixed basket of 383 goods and services collected from households in all 26 regions of mainland Tanzania and serves as a key indicator for investors and businesses monitoring the cost environment in the country.
The overall NCPI rose from 119.85 in May 2025 to 124.90 in May 2026, reflecting an acceleration in price increases across the economy.

The annual Headline Inflation Rate fluctuated between 3.2% and 4.2% throughout the 12-month period from May 2025 to May 2026.
On a monthly basis, the NCPI increased from 124.61 in April 2026 to 124.90 in May 2026, a rise of 0.2%.
Table of Contents
- Food and Non-Alcoholic Beverages
- Non-Food Inflation
- Transport
- Housing, Water, Electricity, Gas and Other Fuels
- Clothing and Footwear
- Restaurants and Accommodation Services
- Furnishings, Household Equipment and Routine Household Maintenance
- Personal Care, Social Protection and Miscellaneous Goods and Services
- Alcoholic Beverages and Tobacco
- Health
- Education Services
- Information and Communication
- Recreation, Sport and Culture
- Insurance and Financial Services
- Core and Supplementary Indices
Food and Non-Alcoholic Beverages
Food and Non-Alcoholic Beverages inflation—the category with the highest weight in the basket at 28.2%—eased slightly to 5.6% year-on-year in May 2026, down from 5.7% recorded in April 2026.
On a monthly basis, food prices edged down by 0.1% between April and May 2026, with the index declining from 138.12 to 137.93.
Food items contributing to monthly price increases included sugar (2.3%), bread (1.3%), beef without bones (1.7%), meat of poultry (1.4%), dried beans (1.4%), milk of cattle (1.0%), dried sardines/dagaa (0.6%), soft drinks (0.5%), dried peas (0.4%), rice (0.4%), maize flour (0.4%), and eggs of hen (0.3%).

Non-Food Inflation
The inflation rate for all items excluding food and non-alcoholic beverages rose to 3.6% year-on-year in May 2026, up from 3.3% recorded in April 2026.
The following categories contributed to non-food price movements during the month.
Transport
Transport recorded by far the highest annual inflation rate among all main groups at 11.9%, with a weight of 14.1% in the NCPI basket.
Its monthly index rose from 130.68 in April 2026 to 133.80 in May 2026, a monthly increase of 2.4%, driven by sharp fuel price increases.
Non-food items in this category contributing to monthly price increases included diesel (13.8%), petrol (10.4%), motorcycle/bodaboda fare (4.4%), bus fare (3.0%), and taxi fare (3.0%).
Housing, Water, Electricity, Gas and Other Fuels
The Housing, Water, Electricity, Gas and Other Fuels category—the third-largest component of the basket with a weight of 15.1%—recorded annual inflation of 0.7%, with its index declining from 120.93 in April 2026 to 119.96 in May 2026, a monthly decrease of 0.8%.
Monthly price increases within this category included gas (3.9%) and kerosene (3.9%).
Clothing and Footwear
Clothing and Footwear recorded annual inflation of 1.5%, with its index rising to 116.45 in May 2026 from 114.71 in May 2025, and a monthly increase of 0.1%, driven by garments for women (0.1%) and garments for children (0.2%).
Restaurants and Accommodation Services
Restaurants and Accommodation Services recorded annual inflation of 1.9%, with its index rising to 119.54 in May 2026 from 117.27 in May 2025, and a monthly increase of 0.3%, driven by food and beverage serving services (0.4%).
Furnishings, Household Equipment and Routine Household Maintenance
Furnishings, Household Equipment and Routine Household Maintenance recorded annual inflation of 2.5%, with its index rising to 118.46 in May 2026 from 115.55 in May 2025, and a monthly increase of 0.1%.
Personal Care, Social Protection and Miscellaneous Goods and Services
Personal Care, Social Protection and Miscellaneous Goods and Services recorded annual inflation of 3.5%, with its index rising to 122.22 in May 2026 from 118.07 in May 2025, and a monthly increase of 0.1%, driven by personal care (0.3%).
Alcoholic Beverages and Tobacco
Alcoholic Beverages and Tobacco recorded annual inflation of 2.1%, with its index declining slightly to 114.66 in May 2026 from 114.74 in April 2026, and a monthly change of -0.1%.
Health
Health recorded annual inflation of 1.4%, with its index rising to 111.08 in May 2026 from 109.53 in May 2025, with no monthly change recorded in May 2026.
Education Services
Education Services recorded annual inflation of 2.7%, with its index rising to 115.18 in May 2026 from 112.16 in May 2025, and a monthly increase of 0.1%.
Information and Communication
Information and Communication recorded annual inflation of 0.9%, with its index at 107.15 in May 2026 from 106.22 in May 2025, with no monthly change recorded in May 2026.
Recreation, Sport and Culture
Recreation, Sport and Culture recorded annual inflation of 0.7%, with its index at 111.92 in May 2026 from 111.19 in May 2025, with no monthly change recorded in May 2026.
Insurance and Financial Services
Insurance and Financial Services recorded the lowest annual inflation among all categories at 0.2%, with its index rising to 102.61 in May 2026 from 102.43 in May 2025, with no monthly change recorded in May 2026.
Core and Supplementary Indices
The Core Inflation Rate—which excludes volatile items such as unprocessed food, energy, and utilities, with the exception of maize flour—rose to 3.4% in May 2026, up from 3.1% recorded in April 2026.
The Core Index covers 297 items representing 73.9% of the total NCPI weight and provides policymakers with a more stable measure of underlying price trends.
The Non-Core Index, which captures the more volatile components of the basket, stood at 6.3% year-on-year in May 2026, with a monthly decrease of 0.2%.
The Energy, Fuel and Utilities Index recorded annual inflation of 5.0%, with a monthly decrease of 0.3%.
The Services Index rose by 4.7% year-on-year and by 0.7% month-on-month, while the Goods Index recorded annual inflation of 4.0% with no monthly change.
The Education Services and Products Ancillary to Education Index recorded annual inflation of 1.5%, while the All Items Less Food and Non-Alcoholic Beverages Index rose by 3.6% year-on-year and by 0.4% month-on-month.
The next NCPI release, covering June 2026, is scheduled for July 8, 2026.
Want to know more about the Economy in Tanzania? Our free overview of the Tanzania Business and Investment Guide 2026 covers the Economy, plus key sectors and investment opportunities. The complete 141-page edition includes policies, taxation, key regulations, full macroeconomic data, and sources.
Download Free OverviewGet the Full Guide