


Tanzania’s annual headline inflation rose to 4.2% in July 2026, up from 4.0% recorded in June, according to data released on 10th August, 2026, by the National Bureau of Statistics (NBS).
The figure is measured by the National Consumer Price Index (NCPI), which tracks price changes across a fixed basket of 383 goods and services, comprising 132 food and non-alcoholic beverage items and 251 non-food items, collected from all 26 regional headquarters on the Tanzanian mainland.
The overall NCPI rose from 119.85 in July 2025 to 124.85 in July 2026, reflecting a gradual upward trend in the general price level.
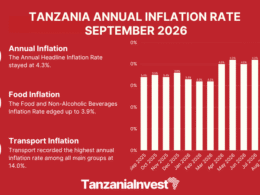
The annual Headline Inflation Rate fluctuated between 3.2% and 4.2% throughout the 12-month period from July 2025 to July 2026, dipping to 3.2% in February and March 2026 before climbing back to 4.2% in July 2026.
On a monthly basis, the NCPI edged down from 125.04 in June 2026 to 124.85 in July 2026, a decrease of 0.1%.
Table of Contents
- Food and Non-Alcoholic Beverages
- Non-Food Inflation
- Transport
- Housing, Water, Electricity, Gas and Other Fuels
- Clothing and Footwear
- Restaurants and Accommodation Services
- Furnishings, Household Equipment and Routine Household Maintenance
- Personal Care, Social Protection and Miscellaneous Goods and Services
- Alcoholic Beverages and Tobacco
- Health
- Education Services
- Information and Communication
- Recreation, Sport and Culture
- Insurance and Financial Services
- Core and Supplementary Indices
Food and Non-Alcoholic Beverages
Food and Non-Alcoholic Beverages inflation, the category with the highest weight in the basket at 28.2%, held steady at 4.1% year-on-year in July 2026, unchanged from June 2026.
On a monthly basis, food prices declined by 0.8% between June and July 2026, with the index falling from 136.92 to 135.79.
Food items recording monthly price declines included sweet potatoes (6.7%), cocoyams (4.5%), maize flour (4.3%), rice (4.2%), maize grains (3.6%), flour of cassava (3.4%), dried cowpeas (2.1%), sorghum grains (2.0%), dried beans (2.0%), vegetables (1.9%), cassava dry (1.4%), groundnuts (1.3%), poultry live (1.1%), bread and bakery products (0.5%), and wheat flour (0.3%).
Non-Food Inflation
The inflation rate for all items excluding food and non-alcoholic beverages rose to 4.2% year-on-year in July 2026, up from 4.0% recorded in June 2026, with its index rising from 120.37 to 120.56, a monthly increase of 0.2%.
The following categories contributed to non-food price movements during the month.
Transport
Transport recorded the highest annual inflation rate among all main groups at 13.8%, up from 13.6% in June 2026, with a weight of 14.1% in the NCPI basket.
Its monthly index rose from 135.98 in June 2026 to 136.11 in July 2026, a monthly increase of 0.1%.
Non-food items in this category contributing to monthly price increases included diesel (3.3%) and petrol (2.5%).
Housing, Water, Electricity, Gas and Other Fuels
The Housing, Water, Electricity, Gas and Other Fuels category, the second-largest component of the basket with a weight of 15.1%, recorded annual inflation of 1.6%, with its index effectively flat at 120.73 in July 2026 from 120.74 in June 2026, a monthly change of 0.0%.
Monthly price increases within this category included charcoal (4.5%) and gas (1.3%).
Clothing and Footwear
Clothing and Footwear recorded annual inflation of 1.6%, with its index rising to 116.69 in July 2026 from 114.89 in July 2025, and a monthly increase of 0.2%.
Individual items within the category recording monthly price increases included clothing materials (0.3%) and garments for infants (0.3%).
Restaurants and Accommodation Services
Restaurants and Accommodation Services recorded annual inflation of 2.7%, with its index rising to 120.51 in July 2026 from 117.35 in July 2025, and a monthly increase of 0.8%.
Furnishings, Household Equipment and Routine Household Maintenance
Furnishings, Household Equipment and Routine Household Maintenance recorded annual inflation of 2.2%, with its index rising to 118.90 in July 2026 from 116.31 in July 2025, and a monthly increase of 0.4%.
Personal Care, Social Protection and Miscellaneous Goods and Services
Personal Care, Social Protection and Miscellaneous Goods and Services recorded annual inflation of 3.4%, with its index at 122.21 in July 2026 from 118.14 in July 2025, and a monthly decline of 0.1%.
Alcoholic Beverages and Tobacco
Alcoholic Beverages and Tobacco recorded annual inflation of 1.9%, with its index rising to 114.67 in July 2026 from 114.49 in June 2026, a monthly increase of 0.2%.
Health
Health recorded annual inflation of 1.4%, with its index at 111.12 in July 2026 from 109.63 in July 2025, and a monthly increase of 0.1%.
Education Services
Education Services recorded annual inflation of 2.8%, with its index at 115.29 in July 2026 from 112.16 in July 2025, and a monthly increase of 0.1%.
Information and Communication
Information and Communication recorded annual inflation of 0.6%, with its index at 106.90 in July 2026 from 106.25 in July 2025, and a monthly decline of 0.3%.
Recreation, Sport and Culture
Recreation, Sport and Culture recorded annual inflation of 0.7%, with its index unchanged at 111.72 in July 2026 from June 2026, and an annual rise from 110.98 in July 2025.
Insurance and Financial Services
Insurance and Financial Services recorded the lowest annual inflation among all main groups at 0.2%, with its index effectively flat at 102.60 in July 2026 from 102.61 in June 2026.
Core and Supplementary Indices
The Core Inflation Rate, which excludes volatile items such as unprocessed food, energy, and utilities, with the exception of maize flour, rose to 3.9% in July 2026, up from 3.7% recorded in June 2026, signaling a continued build-up of underlying price pressures.
The Core Index covers 297 items representing 73.9% of the total NCPI weight, with its index rising from 120.17 in June 2026 to 120.44 in July 2026, a monthly increase of 0.2%.
The Non-Core Index, which captures the more volatile components of the basket, stood at 4.9% year-on-year in July 2026, with a monthly decrease of 1.1%.
The Energy, Fuel and Utilities Index recorded annual inflation of 6.9%, with a monthly decrease of 0.8%.
The Services Index rose by 5.7% year-on-year and by 0.4% month-on-month, while the Goods Index recorded annual inflation of 3.3% with a monthly decline of 0.4%.
The Education Services and Products Ancillary to Education Index recorded annual inflation of 1.7%, while the All Items Less Food and Non-Alcoholic Beverages Index rose by 4.2% year-on-year and by 0.2% month-on-month.
The next NCPI release, covering August 2026, is scheduled for 08th September, 2026.
Want to know more about the Economy in Tanzania? Our free overview of the Tanzania Business and Investment Guide 2026 covers the Economy, plus key sectors and investment opportunities. The complete 141-page edition includes policies, taxation, key regulations, full macroeconomic data, and sources, and is also available at no cost upon completion of a short form.
Download Free OverviewGet the Full Edition for Free