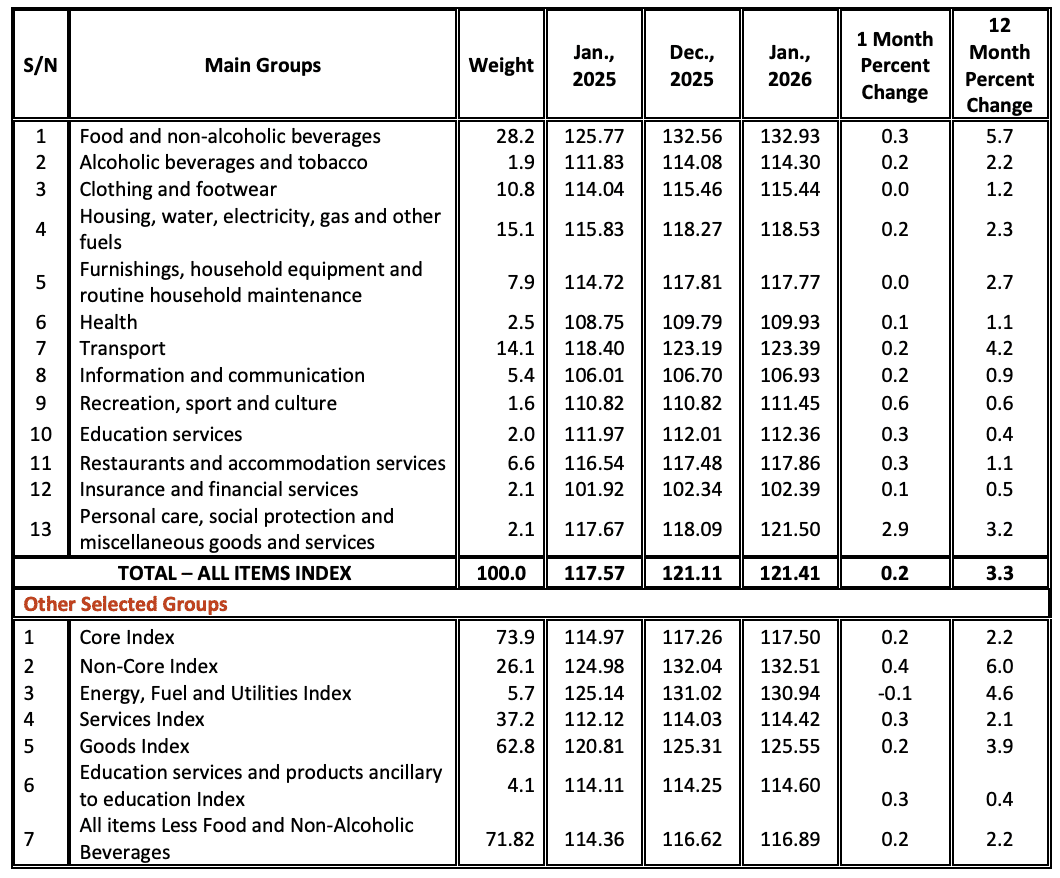
The National Bureau of Statistics of Tanzania (NBS) announced that the annual headline inflation rate for January 2026 decreased to 3.3%, from 3.6% recorded in December 2025.
The overall index rose from 117.57 in January 2025 to 121.41 in January 2026.
Food Inflation

The Food and Non-Alcoholic Beverages inflation rate for January 2026 decreased to 5.7% from 6.7% in December 2025.
Non-Food Inflation
Furthermore, the inflation rate for all items excluding food and non-alcoholic beverages for January 2026 slightly decreased to 2.2% from 2.3% recorded in December 2025.
Core Inflation
The Core Index excludes items with volatile prices, namely unprocessed food, energy, and utilities, except maize flour. By excluding these volatile items from the overall NCPI, policymakers obtain a more stable measure of inflation.

The Core Index comprises 297 items, accounting for 73.9% of the total NCPI weight.
In January 2026, the Core Inflation Rate decreased to 2.2% from 2.5% that was recorded in December 2025.
Monthly Consumer Price Index December 2025-January 2026
Between December 2025 and January 2026, the National Consumer Price Index increased from 121.11 to 121.41. This increase in the overall index is primarily attributed to the rise in prices for certain food and non-food items.
Food items contributing to an increase included: rice (+0.6%); finger millet grains (+0.6%); maize grains (+3.0%); traditionally bred live chicken (+5.5%); industrially bred live chicken (+2.3%); beef (+2.1%); goat meat (+3.9%); meat of poultry (+0.9%); groundnuts (+1.1%); vegetables (+1.7%); Irish potatoes (+9.4%); sweet potatoes (+1.1%); cocoyams (+0.6%); cooking bananas (+4.3%); dried beans (+0.3%), and cowpeas (+2.2%).
Non-food items contributing to an increase included: alcoholic beverages and tobacco (+0.2%); actual rentals paid by tenants (+0.5%); materials for the maintenance and repair of the dwelling (+0.2%); charcoal (+0.3%); petrol (+0.6%); recreation, sport and culture (+0.6%); education services (+0.3%); food and beverage serving services (+0.3%); accommodation services in hotels/Lorges/Guesthouse (+0.4%) and personal care (+0.9%).
Changes in Tanzania National Consumer Price Indices (NCPI) for January 2026, (2020 = 100)
Want to know more about the Economy in Tanzania? Our free overview of the Tanzania Business and Investment Guide 2026 covers the Economy, plus key sectors and investment opportunities. The complete 141-page edition includes policies, taxation, key regulations, full macroeconomic data, and sources.
Download Free OverviewGet the Full Guide