


The National Bureau of Statistics of Tanzania (NBS) announced that the annual headline inflation rate for September 2025 remained unchanged at 3.4%, as it was recorded in August 2025.
This stagnation indicates that the pace of price changes for commodities in the year ending September 2025 was the same as in the year ended August 2025.
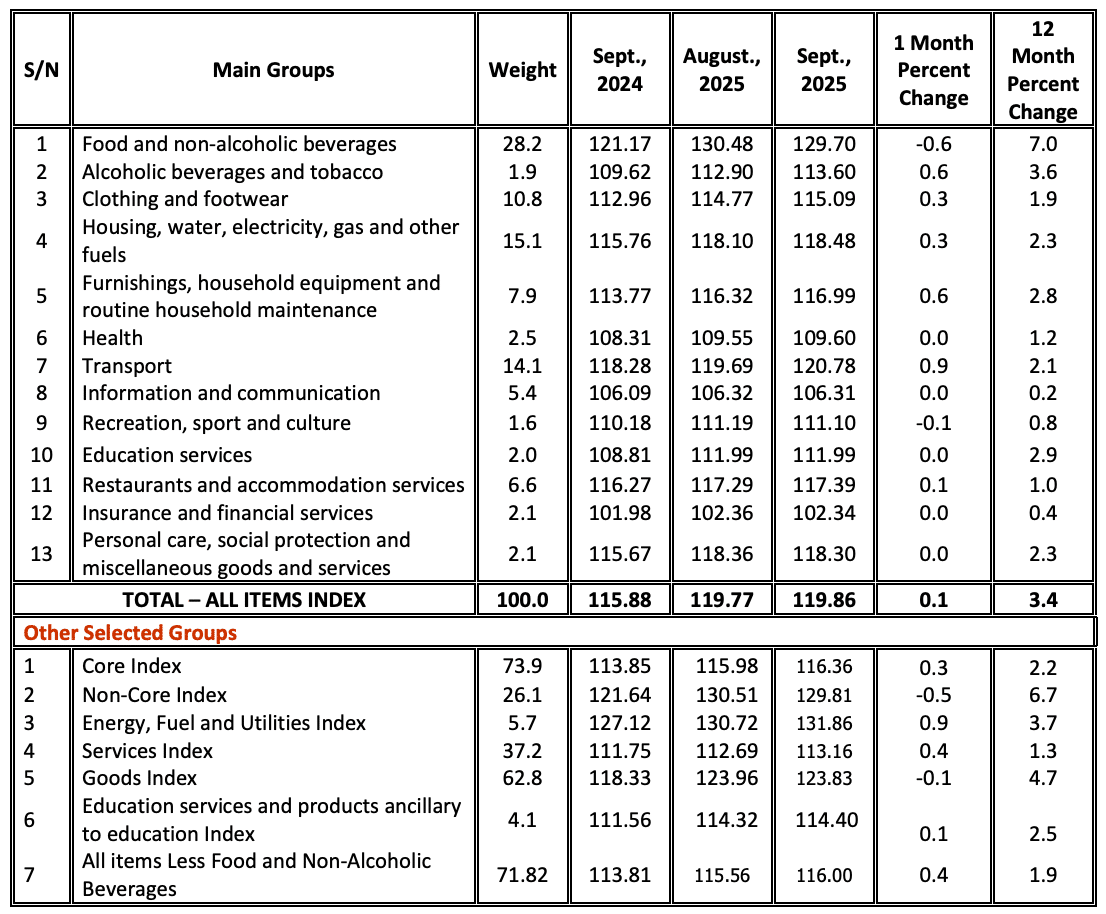
The overall index increased from 115.88 in September 2024 to 119.86 in September 2025.

Food Inflation
The Food and Non-Alcoholic Beverages Inflation Rate for September 2025 has decreased to 7.0% from 7.7% in August 2025.
Non-Food Inflation
In contrast, all items excluding food and non-alcoholic beverages recorded a slight increase to 1.9% in September 2025, from 1.6% in August 2025.
Core Inflation

The Core Index excludes items with volatile prices, namely unprocessed food, energy, and utilities (with the exception of maize flour) to obtain a more stable measure of inflation.
The Core Index covers 297 items, representing 73.9% of the total NCPI weight.
In September 2025, the Core Inflation Rate rose to 2.2% from 2.0% in August 2025.
Monthly Consumer Price Index August-September 2025
Between August 2025 and September 2025, the National Consumer Price Index increased from 119.77 to 119.86.
This increase in the overall index is mainly attributed to the increase of prices for some food and non-food items.
Food items contributing to the increase included: sorghum flour (by 3.6%), bread and bakery products (by 1.0%), industrially bred live chicken (by 5.0%), meat of poultry (by 3.6%), fresh fish (by 1.0%), fruits (by 2.2%), irish potatoes (by 0.8%), sweet potatoes (by 7.6%), fresh cassava (by 2.2%), cocoyams (by 8.9%), cooking bananas (by 1.8%) and dried peas (by 4.0%).
Non-food items contributing to the increase included: alcoholic beverages and tobacco (by 0.6%), clothing materials (by 0.5%), garments for men (by 0.9%), footwear for men (by 0.4%), liquefied hydrocarbons (by 0.1%), kerosene (by 1.1%), wood charcoal (by 2.7%), household furniture (by 1.0%) and small household appliances (by 0.5%).
Changes in Tanzania National Consumer Price Indices (NCPI) for September 2025, (2020 = 100)
Want to know more about the Economy in Tanzania? Our free overview of the Tanzania Business and Investment Guide 2026 covers the Economy, plus key sectors and investment opportunities. The complete 141-page edition includes policies, taxation, key regulations, full macroeconomic data, and sources.
Download Free OverviewGet the Full Guide — USD 99