


During Week 34 of 2026, spanning August 17th to August 21st, equity turnover fell sharply -22.46% compared with Week 33 of 2026, even as TOL (+17.45%) emerged as the week’s top-gaining stock.
Throughout this report, individual stock and index percentage changes reflect close-to-close moves between 14th August 2026 (Week 33 of 2026 closing day) and 21st August 2026 (Week 34 of 2026 closing day). Turnover, volume and deals comparisons reflect totals across the full trading weeks.
Equity Turnover and Volume
Equity Turnover excluding ETF trades reached TZS 23.30 billion, a sharp decline of -22.46% compared to Week 33 of 2026’s TZS 30.05 billion.

A total of 7,261,335 shares changed hands across 15,576 deals, a sharp decline of -13.85% versus Week 33 of 2026’s 8,428,927 shares.
CRDB led all counters by volume with 2,272,803 shares traded, while NMB dominated by turnover, generating TZS 11.52 billion.
NMB, CRDB, and VODA have been persistent fixtures among the top five turnover counters in recent weeks, underscoring their continued dominance of activity on the exchange.
ETF Trading
ETF trading across the two listed funds generated combined turnover of TZS 1.21 billion on volume of 1,200,319 units, a +44.42% increase versus Week 33 of 2026’s TZS 836.02 million.
| ETF | Closing Price (TZS) 14th August 2026 | Closing Price (TZS) 21st August 2026 | Variation |
|---|---|---|---|
| IEACLC-ETF | 1,340 | 1,370 | +2.24% |
| VERTEX-ETF | 335 | 345 | +2.99% |
Foreign Investor Activity
Local investors accounted for 99.81% of buying and 86.51% of selling, against foreign investor shares of 0.19% and 13.49% respectively, producing a net foreign net selling position of USD 1,172,119 for the week.
This extends a four-week streak of foreign net selling on the exchange.
| % Local Buying | % Foreign Buying | % Local Selling | % Foreign Selling | Net Foreign Flow (USD) |
|---|---|---|---|---|
| 99.81% | 0.19% | 86.51% | 13.49% | -1,172,119 |
Market Capitalisation
Total market capitalisation closed Week 34 of 2026 at TZS 37,048.62 billion, a +0.41% change versus Week 33 of 2026’s TZS 36,898.87 billion.
Domestic market capitalisation stood at TZS 25,342.45 billion, a -0.12% change versus Week 33 of 2026.
ETF market capitalisation reached TZS 211.96 billion, advancing +2.31% over the same period.
| Measure | 14th August 2026 (TZS billion) | 21st August 2026 (TZS billion) | Variation |
|---|---|---|---|
| Total Market Capitalisation | 36,898.87 | 37,048.62 | +0.41% |
| Domestic Market Capitalisation | 25,371.63 | 25,342.45 | -0.12% |
| ETF Market Capitalisation | 207.18 | 211.96 | +2.31% |
Indexes
Four of the five Dar es Salaam Stock Exchange indices closed lower relative to Week 33 of 2026, with the All Share Index (DSEI) the sole gainer and the biggest mover by absolute change, advancing +0.41%.
The All Share Index (DSEI) rose +0.41%, while the Tanzania Share Index (TSI) slipped -0.12%, the Industrial & Allied (IA) index edged down -0.20%, the Banks, Finance & Investment (BI) index dipped -0.08%, and the Commercial Services (CS) index fell -0.14%.
| Index | Closing Value 14th August 2026 | Closing Value 21st August 2026 | Variation |
|---|---|---|---|
| All Share Index (DSEI) | 4,232.85 | 4,250.04 | +0.41% |
| Tanzania Share Index (TSI) | 9,331.91 | 9,321.17 | -0.12% |
| Industrial & Allied (IA) | 5,088.19 | 5,077.88 | -0.20% |
| Banks, Finance & Investment (BI) | 20,714.64 | 20,698.12 | -0.08% |
| Commercial Services (CS) | 2,881.50 | 2,877.51 | -0.14% |
Stock Performances
Compared with Week 33 of 2026, the week’s strongest performers were TOL, which surged +17.45%, followed by MBP with a gain of +9.52% and DCB rising +8.60%.
On the losing side, PAL led declines with a drop of -8.70%, ahead of NMG, which fell -7.27%, and NICO, which slipped -1.57%.
TBL extended its losing streak into a third consecutive week or more, marking a persistent period of weakness for the counter.
| Stock | Closing Price (TZS) 14th August 2026 | Closing Price (TZS) 21st August 2026 | Variation |
|---|---|---|---|
| AFRIPRISE | 625 | 620 | -0.80% |
| CRDB | 2,700 | 2,690 | -0.37% |
| DCB | 465 | 505 | +8.60% |
| DSE | 6,570 | 6,480 | -1.37% |
| EABL | 5,590 | 5,710 | +2.15% |
| JATU | 265 | 270 | +1.89% |
| JHL | 8,650 | 8,650 | 0.00% |
| KA | 110 | 115 | +4.55% |
| KCB | 1,950 | 1,970 | +1.03% |
| MBP | 1,680 | 1,840 | +9.52% |
| MCB | 405 | 430 | +6.17% |
| MKCB | 3,760 | 3,790 | +0.80% |
| MUCOBA | 455 | 455 | 0.00% |
| NICO | 3,820 | 3,760 | -1.57% |
| NMB | 17,700 | 17,700 | 0.00% |
| NMG | 275 | 255 | -7.27% |
| PAL | 345 | 315 | -8.70% |
| SWALA | 450 | 450 | 0.00% |
| SWIS | 2,570 | 2,610 | +1.56% |
| TBL | 9,930 | 9,900 | -0.30% |
| TCC | 12,500 | 12,320 | -1.44% |
| TCCL | 3,950 | 4,000 | +1.27% |
| TOL | 1,490 | 1,750 | +17.45% |
| TPCC | 6,050 | 5,980 | -1.16% |
| TTP | 450 | 475 | +5.56% |
| USL | 30 | 30 | 0.00% |
| VODA | 1,020 | 1,020 | 0.00% |
| YETU | 510 | 510 | 0.00% |
Bond Market
Bond turnover totaled TZS 41.92 billion across 220 deals, a decline of -57.65% compared to Week 33 of 2026’s TZS 98.98 billion, even as deal count rose from 148 to 220 (+48.65%).
The average trade size shrank from TZS 668.78 million to TZS 190.55 million (-71.51%), pointing to broader participation at smaller ticket sizes rather than a retreat in activity.
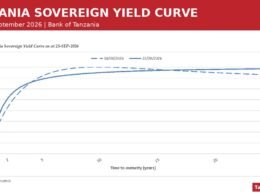
The yield curve flattened as the 5-year tenor rose sharply by 248.1 basis points while the 25-year tenor edged up a more modest 28.7 basis points, compressing the spread between short and long maturities.
The most striking individual move came from the 10-year bond, where yields climbed +371.4 basis points to reach 14.7980%, the largest week-on-week shift across the curve.
| Tenor | Coupon (weighted avg) | Weighted Average Yield 21st August 2026 | Weighted Average Yield 14th August 2026 | Change (bps) | Trade Count | Face Value Traded (TZS billion) |
|---|---|---|---|---|---|---|
| 5Y | 13.1923% | 14.5598% | 12.0785% | +248.1 | 7 | 0.0520 |
| 10Y | 11.4400% | 14.7980% | 11.0838% | +371.4 | 1 | 0.0020 |
| 15Y | 12.2500% | 10.5558% | 11.7679% | -121.2 | 1 | 0.0200 |
| 20Y | 13.6176% | 11.7776% | 11.6720% | +10.6 | 73 | 15.6155 |
| 25Y | 13.4407% | 11.4661% | 11.1792% | +28.7 | 133 | 26.1078 |
Want to know more about Capital Markets in Tanzania? Our upcoming Capital Markets Guide covers the Dar es Salaam Stock Exchange (DSE), listed companies, bonds, and private equity, plus the regulatory framework for investing in Tanzania’s capital markets.
Learn MoreWant to know more about the Capital Markets in Tanzania? Our free overview of the Tanzania Business and Investment Guide 2026 covers the Capital Markets, plus key sectors and investment opportunities. The complete 141-page edition includes policies, taxation, key regulations, full macroeconomic data, and sources, and is also available at no cost upon completion of a short form.
Download Free OverviewGet the Full Edition for Free