

The Dar es Salaam Stock Exchange (DSE) recorded a 22.23% growth in 2024, placing it among Africa’s top-performing stock markets.
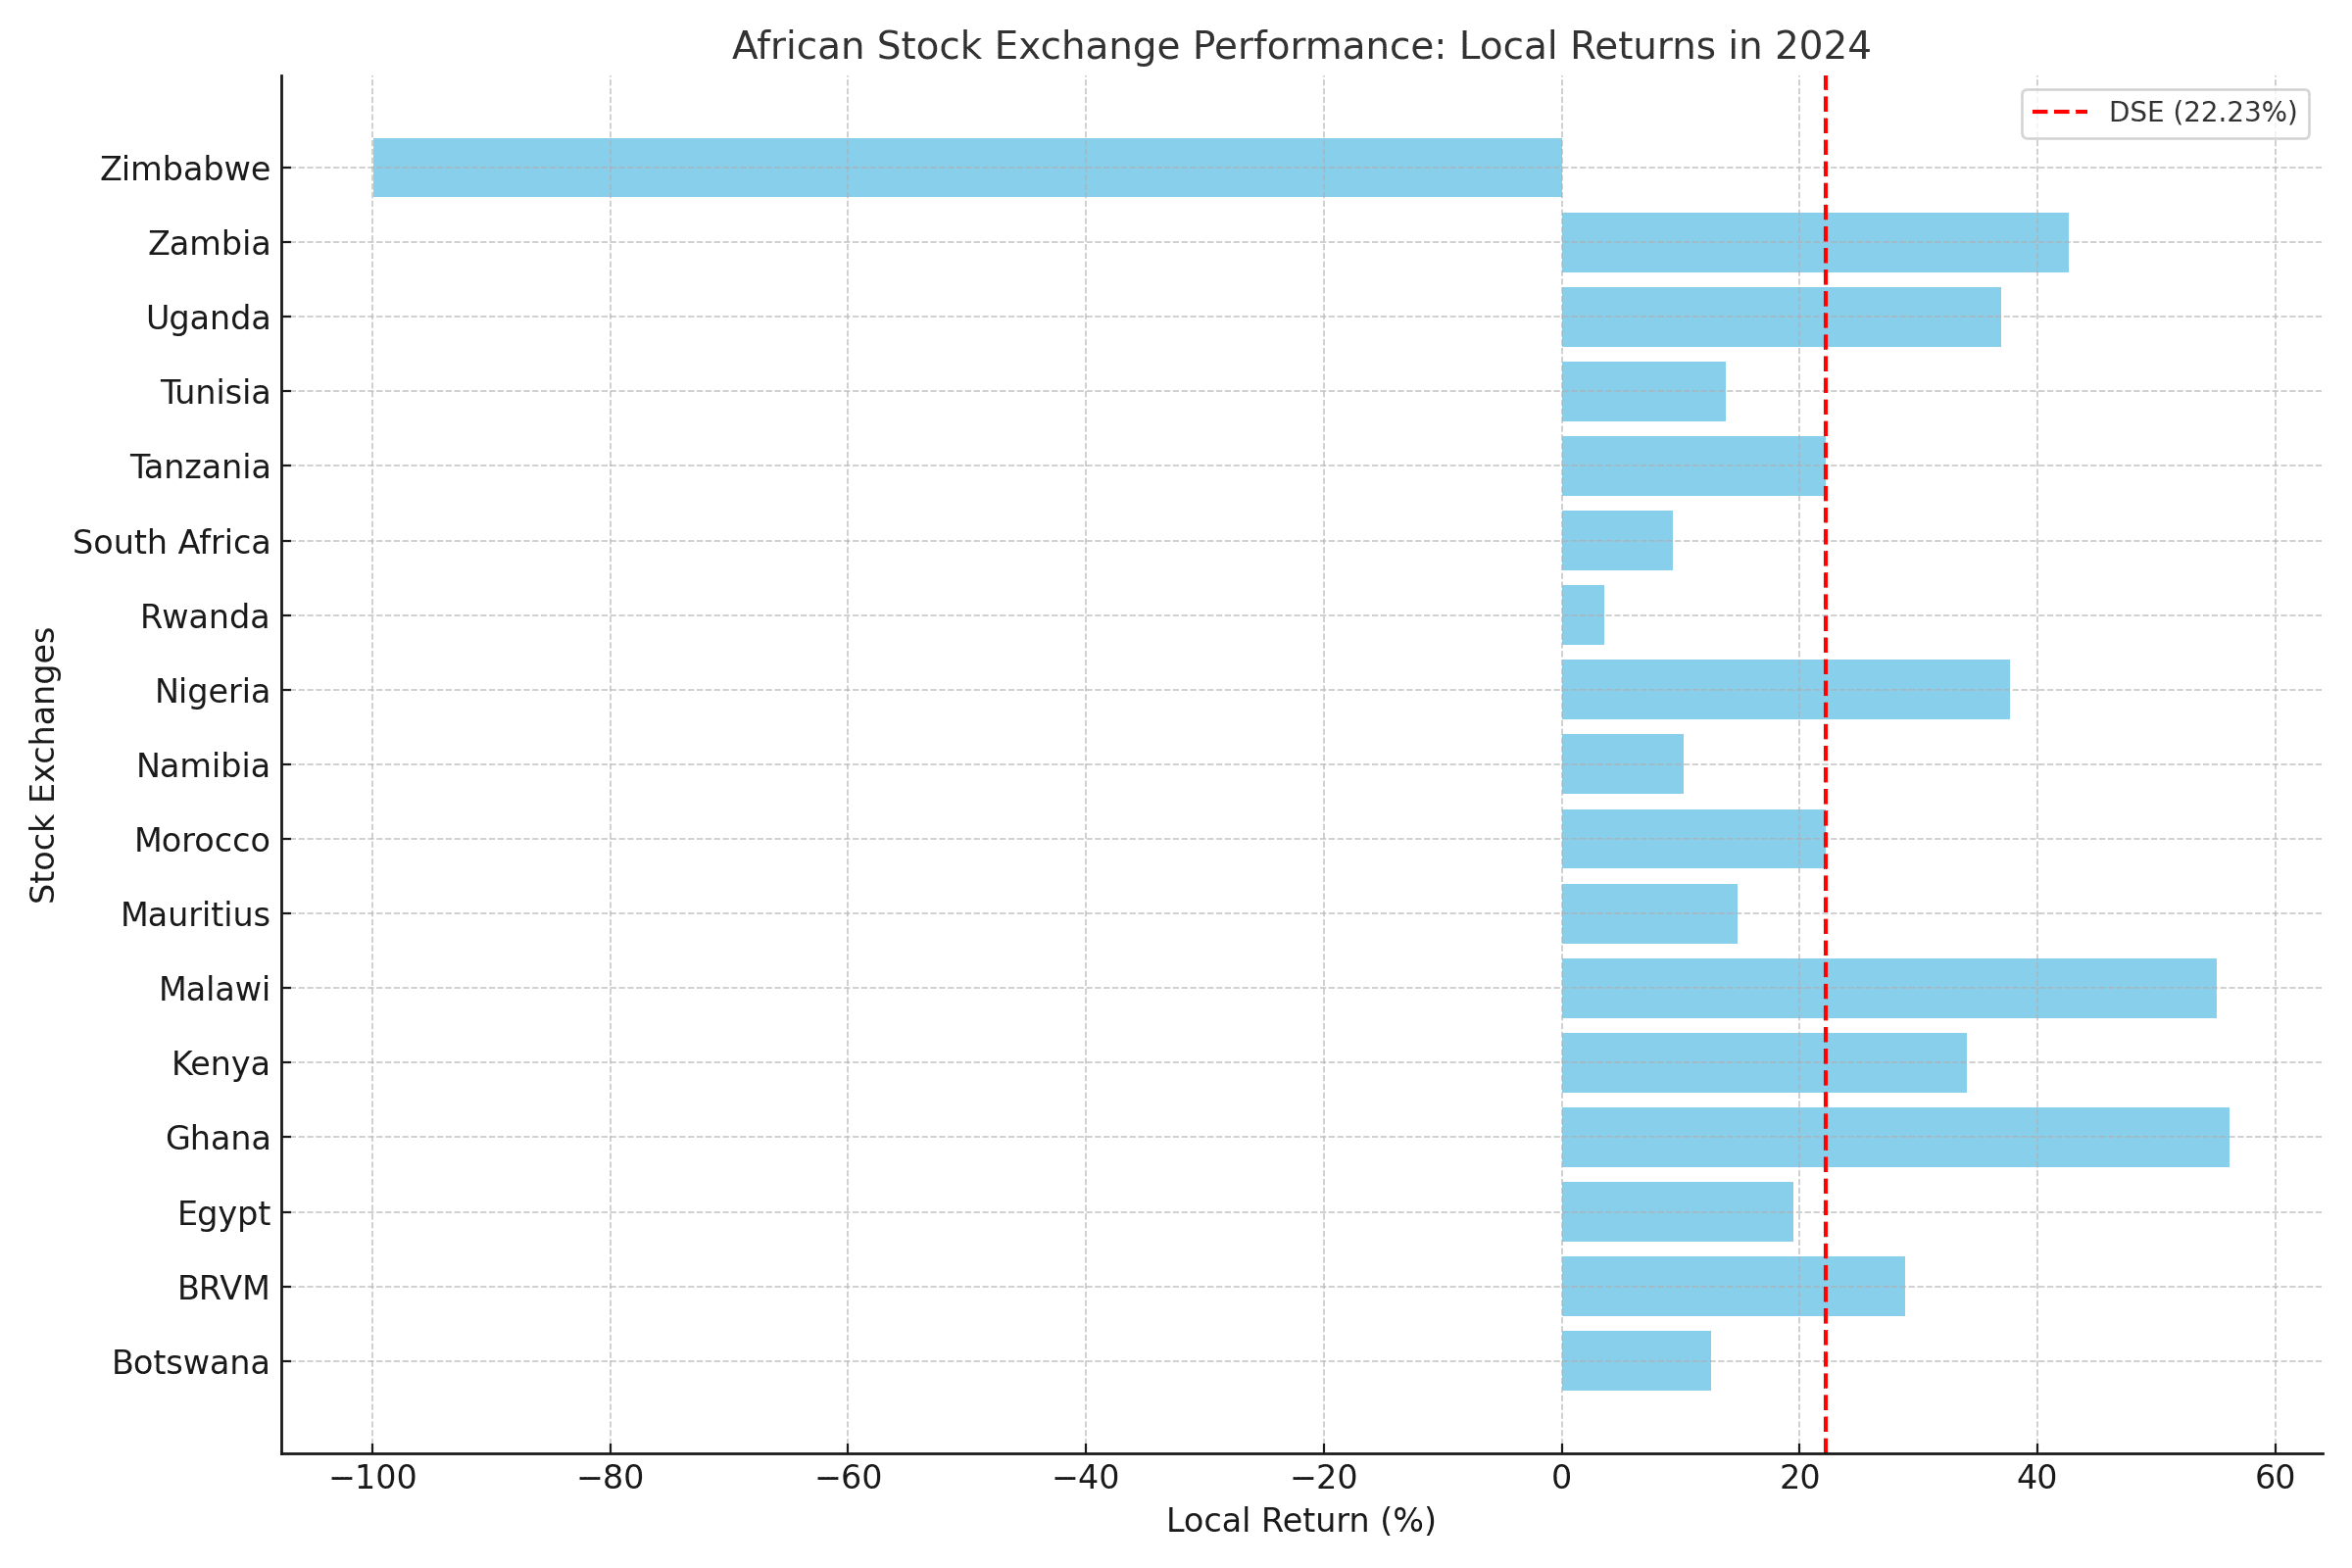
The DSE outperformed several larger markets, such as South Africa (9.37%), Mauritius (14.75%), and Namibia (10.28%), while showing steady progress in both local and USD terms.
| Selected Market | Index Name | Index Level | Local % Change | USD % Change* | EUR % Change* |
| Botswana | BSE DCI | 10,049.11 | 12.54% | 8.04% | 14.42% |
| BRVM | BRVM-CI | 276.02 | 28.89% | 21.12% | 28.64% |
| Egypt | EGX 30 | 29,740.58 | 19.47% | -27.23% | -22.47% |
| Ghana | GSE-CI | 4,888.53 | 56.17% | 25.88% | 32.88% |
| Kenya | NSE ASI | 123.48 | 34.06% | 62.89% | 73.07% |
| Malawi | MSE ASI | 172,039.93 | 55.06% | 50.03% | 59.21% |
| Mauritius | SEM ASI | 2,149.11 | 14.75% | 7.47% | 14.38% |
| Morocco | MASI | 14,773.19 | 22.16% | 19.63% | 27.33% |
| Namibia | NSX OI | 1,801.18 | 10.28% | 8.02% | 15.49% |
| Nigeria | NGX ASI | 102,926.40 | 37.65% | -19.56% | -15.08% |
| Rwanda | RSE ASI | 148.84 | 3.58% | -6.83% | -1.70% |
| South Africa | JSE ASI | 84,095.13 | 9.37% | 6.25% | 13.12% |
| Tanzania | DSE ASI | 2,139.73 | 22.23% | 26.87% | 33.48% |
| Tunisia | TUNINDEX | 9,953.71 | 13.75% | 9.30% | 16.43% |
| Uganda | USE ASI | 1,194.80 | 36.94% | 40.47% | 49.43% |
| Zambia | LuSE ASI | 15,440.90 | 42.60% | 31.49% | 39.48% |
| Zimbabwe | ZSE ASI | 217.58 | -99.90% | -75.55% | -74.02% |
| Average | 18.80% | 11.08% | 17.89% |
Source: african markets. * Indicative.
Regional Comparisons
The DSE’s local return (22.23%) exceeded the African average growth in 2024 of 18.80%, which was skewed upward by exceptional performances in markets like Ghana (56.17%) and Malawi (55.06%).
The DSE outperformed many regional peers:
- South Africa (JSE), which saw a modest 9.37% local return.
- Namibia (NSX), which recorded a 10.28% local return.
- Mauritius (SEM), which delivered a 14.75% local return.
At the same time, the DSE lagged behind exceptional performers such as:
- Ghana (56.17%), driven by a strong recovery in its equity markets.
- Malawi (55.06%), which saw significant investor confidence.
The DSE also delivered strong USD returns (26.87%) and EUR returns (33.48%), making it an attractive investment destination for foreign and European investors.
The DSE’s performance was driven largely by stability in its currency and the resilience of its key sectors, particularly banking and financial services.
Year-on-Year Index Performance
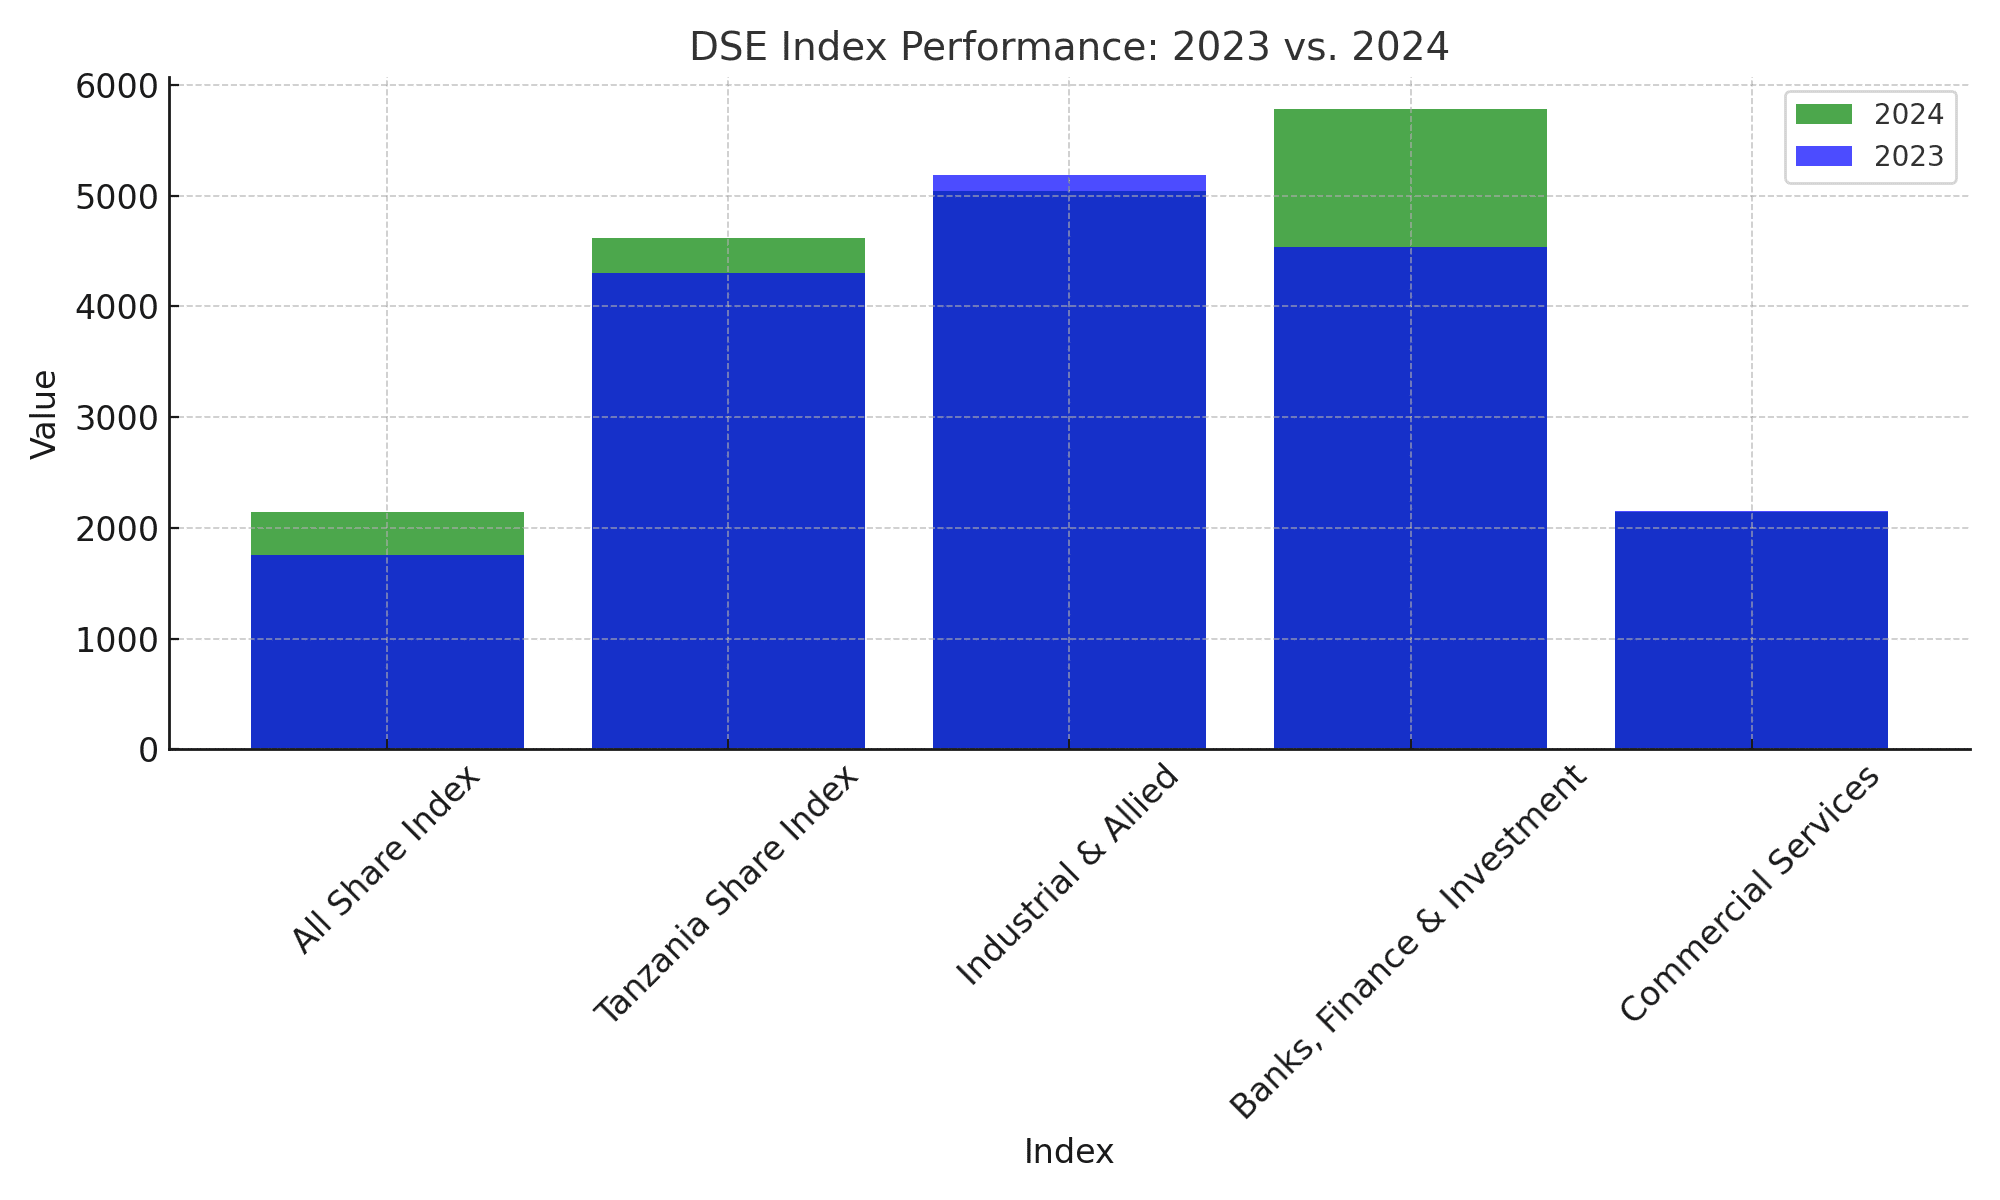
In 2024, the DSE All-Share Index (DSEI) grew from 1,750.63 at the end of 2023 to 2,139.73 by 31st December 2024, a 22.23% increase.
The Tanzania Share Index (TSI), which measures domestic stocks, rose by 7.30%.
Sectoral performance:
The Banks, Finance & Investment surged by 27.50%, reflecting the strength of the financial sector.
The Industrial & Allied and Commercial Services sectors faced minor declines of -2.66% and -0.43%, respectively.
Stock Performance: Top Gainers and Losers
The banking and financial sector dominated stock performance:
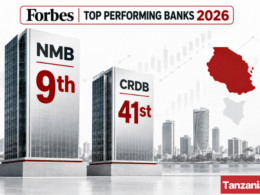
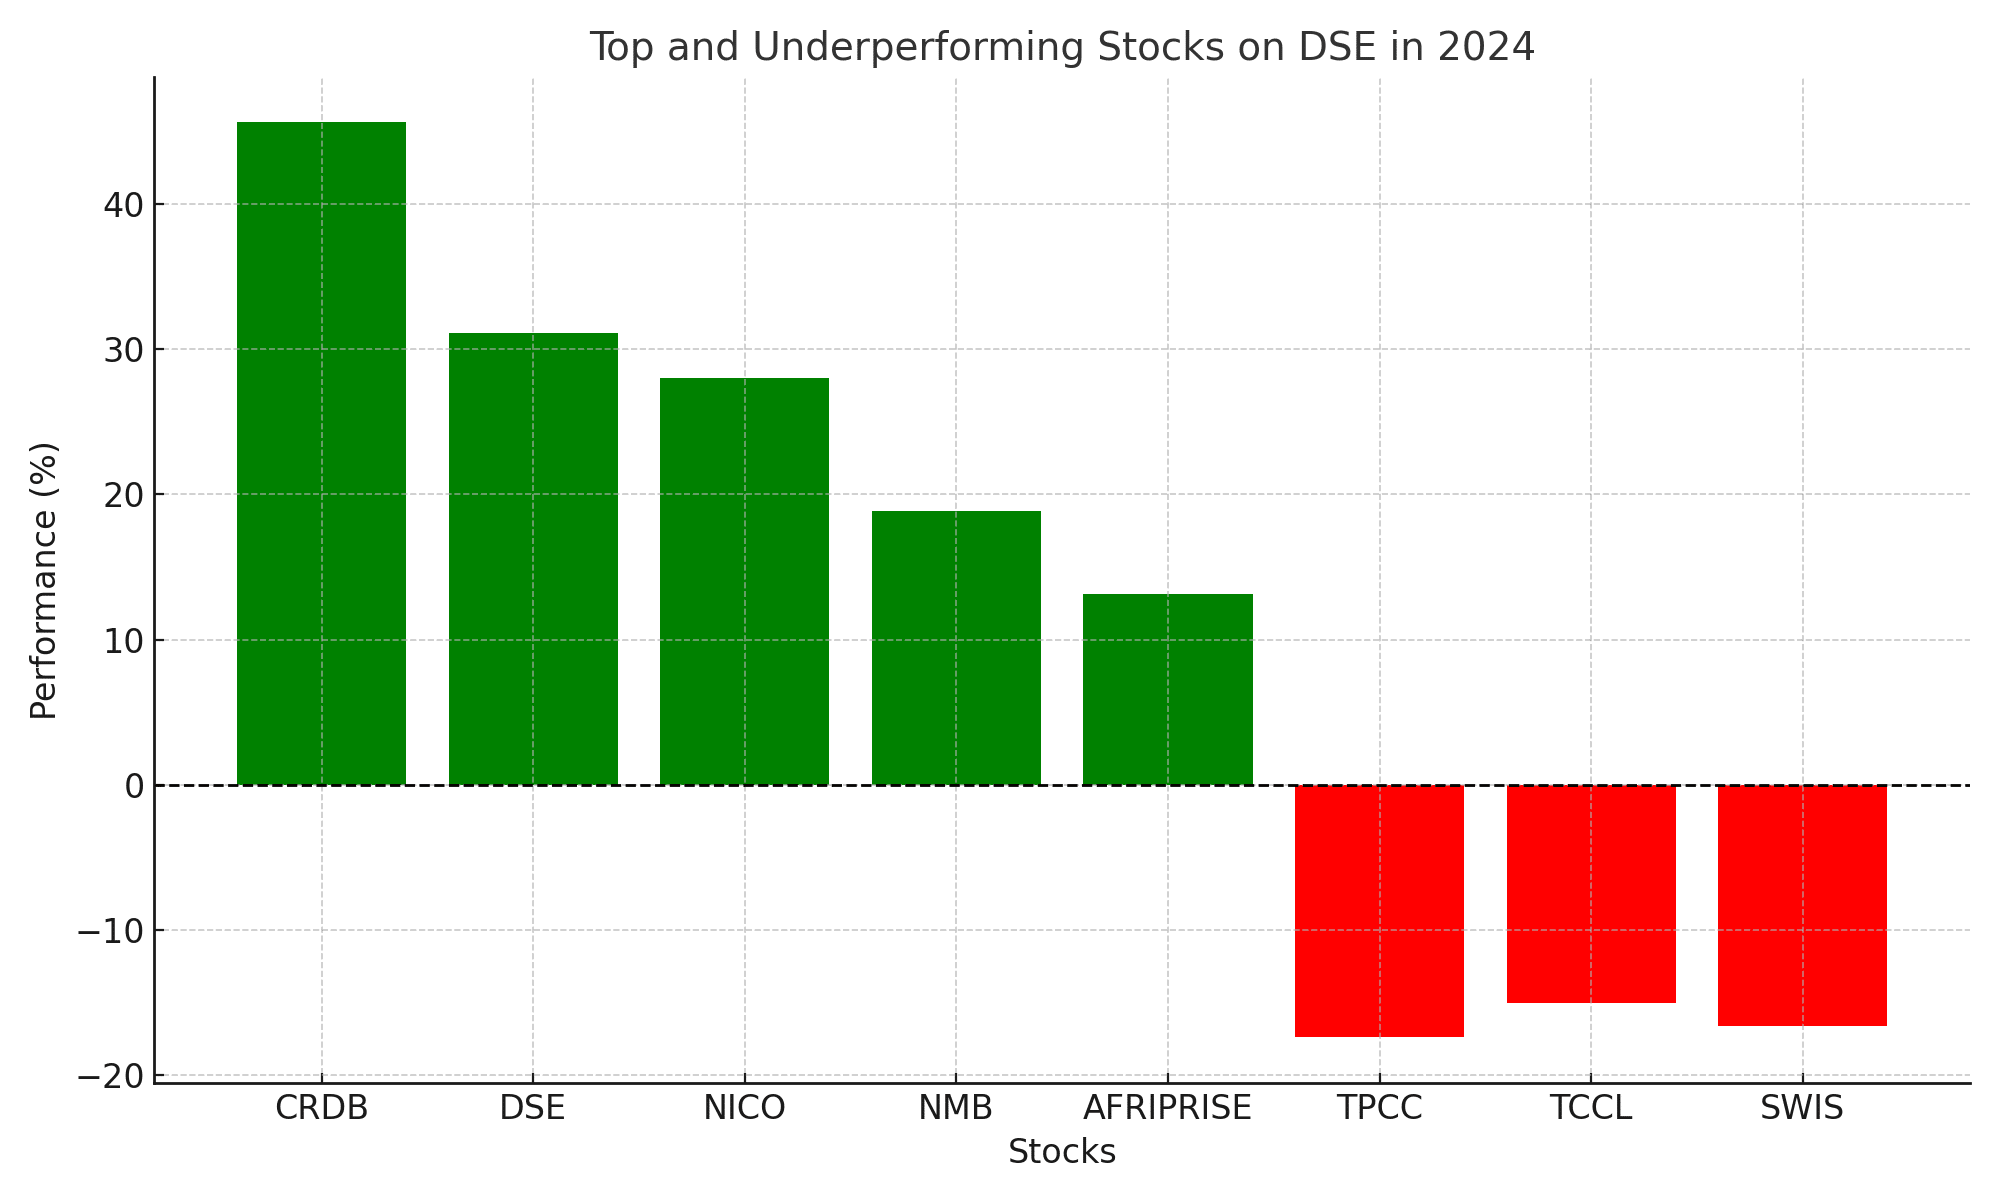
- CRDB Bank delivered the highest gain at 45.65%, showcasing its dominant position and profitability.
- DSE Plc, the exchange itself, rose by 31.11%, benefiting from increased trading volumes.
- NICO Insurance gained 28.00%, while NMB Bank advanced by 18.89%, reflecting sector-wide growth.
Underperformers included:
- TPCC (Tanzania Portland Cement), which dropped by -17.43%.
- Swissport Tanzania and TCCL (Tanga Cement) declined by -16.67% and -15.09%, respectively.
Market Capitalization Growth
The DSE’s total market capitalization increased by 22.29%, from TZS 14,611.43 billion in 2023 to TZS 17,868.17 billion by the end of 2024.
The domestic market capitalization grew by 7.38%, from TZS 11,401.41 billion to TZS 12,243.37 billion.
Market concentration is significant, with a few large stocks dominating the market capitalization. Tanzania Breweries Limited (TBL) holds the largest share of market capitalization at 18.00%, followed by NMB Bank at 14.97%, East African Breweries Limited (EABL) at 14.34%, and Kenya Commercial Bank (KCB) at 12.97%. These four companies alone account for over 60% of the total DSE capitalization.
| Stock | Market Capitalization (TZS Billions) | % Over Total DSE Capitalization |
| AFRIPRISE | 31.4 | 0.18% |
| CRDB | 1,749.93 | 9.79% |
| DCB | 22 | 0.12% |
| DSE | 56.22 | 0.31% |
| EABL | 2,562.11 | 14.34% |
| JATU | 5.28 | 0.03% |
| JHL | 244.23 | 1.37% |
| KA** | 454.51 | 2.54% |
| KCB | 2,316.87 | 12.97% |
| MBP | 8.19 | 0.05% |
| MCB | 19.17 | 0.11% |
| MKCB | 12.72 | 0.07% |
| MUCOBA | 13.07 | 0.07% |
| NICO | 39.45 | 0.22% |
| NMB | 2,675.00 | 14.97% |
| NMG | 45.25 | 0.25% |
| PAL | 64.19 | 0.36% |
| SWALA | 47.79 | 0.27% |
| SWIS | 39.6 | 0.22% |
| TBL | 3,216.11 | 18.00% |
| TCC | 1,700.00 | 9.51% |
| TCCL | 114.61 | 0.64% |
| TOL | 38.53 | 0.22% |
| ТРСС | 647.72 | 3.62% |
| TTP | 11.41 | 0.06% |
| USL | 1.82 | 0.01% |
| VODA | 1,724.80 | 9.65% |
| YETU | 6.18 | 0.03% |
| TOTAL | 17868.16 |
Conclusion
The Dar es Salaam Stock Exchange delivered an impressive 22.23% growth in 2024, driven by gains in the banking sector and a stable macroeconomic environment. Its performance highlights its growing significance in Africa’s financial markets.
Want to know more about Capital Markets in Tanzania? Our upcoming Capital Markets Guide covers the Dar es Salaam Stock Exchange (DSE), listed companies, bonds, and private equity, plus the regulatory framework for investing in Tanzania’s capital markets.
Learn MoreWant to know more about Banking in Tanzania? Our free overview of the Tanzania Business and Investment Guide 2026 covers Banking, plus key sectors and investment opportunities. The complete 141-page edition includes policies, taxation, key regulations, full macroeconomic data, and sources, and is also available at no cost upon completion of a short form.
Download Free OverviewGet the Full Edition for Free