

The trading week ending Friday 22nd August 2025 at the Dar es Salaam Stock Exchange (DSE), recorded equity turnover of TZS 9.38 billion (-74.58% week-on-week), bond turnover of TZS 257.51 billion (+28.50%), and a -2.73% decline in total market capitalisation.
Equity Turnover and Volume
Equity turnover reached TZS 9.38 billion, down -74.58% from the previous week’s TZS 36.90 billion. Share volume decreased to 7.83 million from 21.60 million, a -63.75% change.
Trading volume was heavily concentrated. DCB led activity with 3.75 million shares traded, followed by CRDB with 2.06 million shares. Together, these two counters accounted for 74% of the week’s total equity volume.

Other notable contributors to volume included KCB (544,793 shares), AFRIPRISE (496,221 shares), and VODA (279,975 shares).
| Stock | Week-Total Shares Traded |
| DCB | 3,746,628 |
| CRDB | 2,056,874 |
| KCB | 544,793 |
| AFRIPRISE | 496,221 |
| VODA | 279,975 |
| NMB | 227,294 |
| TBL | 213,258 |
| JHL | 64,200 |
| MKCB | 44,202 |
| MBP | 39,018 |
| NICO | 26,151 |
| TOL | 16,885 |
| TPCC | 14,586 |
| PAL | 14,479 |
| DSE | 11,246 |
| SWIS | 9,234 |
| TTP | 7,324 |
| TCC | 7,011 |
| TCCL | 4,704 |
| MCB | 4,958 |
| MUCOBA | 827 |
| EABL | 0 |
| JATU | 0 |
| KA | 0 |
| NMG | 0 |
| SWALA | 0 |
| USL | 0 |
| YETU | 0 |
Market Capitalisation
Total market capitalisation stood at TZS 21,999.74 billion at the end of Week 34 2025, down -2.73% from TZS 22,616.14 billion a week earlier. Domestic market capitalisation decreased by -6.14% to TZS 14,254.60 billion from TZS 15,187.60 billion.
Bond Market
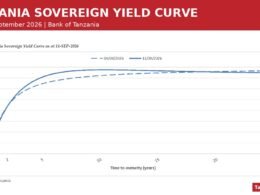
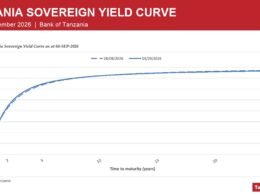
Bond turnover totalled TZS 257.51 billion, up 28.50% week-on-week from TZS 200.39 billion recorded in Week 33. Government securities continued to dominate activity, with trading across 7-, 10-, 15-, 20-, and 25-year maturities; corporate bond activity was minimal.
Indexes
All five DSE benchmarks declined. The Banks, Finance & Investment Index (BI) led the losses with -7.93%, followed by the Commercial Services Index (CS) at -6.19%, the Tanzania Share Index (TSI) at -6.14%, the Industrial & Allied Index (IA) at -3.13%, and the All-Share Index (DSEI) at -2.73%.
| Index | Closing Value 15th August 2025 | Closing Value 22nd August 2025 | Variation |
| All Share Index (DSEI) | 2,638.42 | 2,566.50 | -2.73% |
| Tanzania Share Index (TSI) | 5,737.09 | 5,384.65 | -6.14% |
| Industrial & Allied (IA) | 4,434.02 | 4,295.44 | -3.13% |
| Banks, Finance & Investment (BI) | 10,751.23 | 9,898.29 | -7.93% |
| Commercial Services (CS) | 1,752.60 | 1,644.14 | -6.19% |
Stock Performances
Gains were led by DCB (+39.02%), MKCB (+28.38%), and MCB (+21.31%), while losses were recorded by NICO (-32.65%), CRDB (-20.13%), and TPCC (-10.46%).
| Stock | Closing Price (TZS) 15th August 2025 | Closing Price (TZS) 22nd August 2025 | Variation % |
| AFRIPRISE | 500 | 530 | 6.00% |
| CRDB | 1,590 | 1,270 | -20.13% |
| DCB | 205 | 285 | 39.02% |
| DSE | 4,550 | 4,920 | 8.13% |
| EABL | 4,160 | 4,160 | 0.00% |
| JATU | 265 | 265 | 0.00% |
| JHL | 5,500 | 5,770 | 4.91% |
| KA | 105 | 105 | 0.00% |
| KCB | 1,040 | 1,140 | 9.62% |
| MBP | 865 | 830 | -4.05% |
| MCB | 305 | 370 | 21.31% |
| MKCB | 2,220 | 2,850 | 28.38% |
| MUCOBA | 400 | 400 | 0.00% |
| NICO | 1,960 | 1,320 | -32.65% |
| NMB | 8,020 | 8,310 | 3.62% |
| NMG | 280 | 280 | 0.00% |
| PAL | 255 | 220 | -13.73% |
| SWALA | 450 | 450 | 0.00% |
| SWIS | 2,320 | 2,110 | -9.05% |
| TBL | 7,810 | 7,790 | -0.26% |
| TCC | 15,080 | 14,490 | -3.91% |
| TCCL | 2,260 | 2,360 | 4.42% |
| TOL | 900 | 1,000 | 11.11% |
| TPCC | 5,640 | 5,050 | -10.46% |
| TTP | 120 | 135 | 12.50% |
| USL | 5 | 5 | 0.00% |
| VODA | 605 | 570 | -5.79% |
| YETU | 510 | 510 | 0.00% |
Want to know more about Capital Markets in Tanzania? Our upcoming Capital Markets Guide covers the Dar es Salaam Stock Exchange (DSE), listed companies, bonds, and private equity, plus the regulatory framework for investing in Tanzania’s capital markets.
Learn MoreWant to know more about the Capital Markets in Tanzania? Our free overview of the Tanzania Business and Investment Guide 2026 covers the Capital Markets, plus key sectors and investment opportunities. The complete 141-page edition includes policies, taxation, key regulations, full macroeconomic data, and sources, and is also available at no cost upon completion of a short form.
Download Free OverviewGet the Full Edition for Free