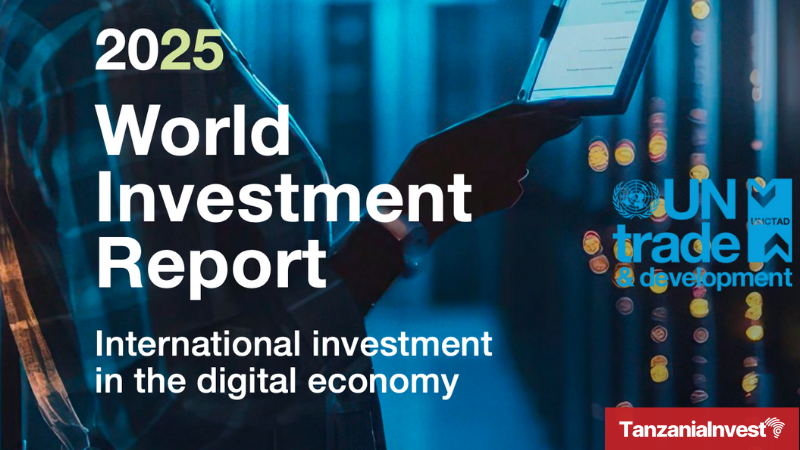
Tanzania attracted USD 1.72 billion in foreign direct investment (FDI) in 2024, a 28.3% increase from USD 1.34 billion in 2023, according to the UNCTAD World Investment Report 2025 recently released.
The increase positioned Tanzania 11th among African countries for total FDI inflows and 13th for FDI inflow growth.
In the East African context, Tanzania was third in East Africa for total FDI inflows behind Ethiopia and Uganda, and first for FDI inflow growth.
Tanzania’s FDI growth rate of 28.3% exceeded both the East African regional average of 12%, and the continental average of 12% (excluding Egypt’s megaproject, which raised the continental average to 75%).
FDI inflows to East Africa as a whole reached USD 12.72 billion in 2024, up from USD 11.34 billion in 2023.
Ethiopia attracted USD 3.98 billion (+21.9%), Uganda USD 3.31 billion (+10.4%), Tanzania USD 1.72 billion (+28.3%), Kenya USD 1.50 billion (virtually unchanged), Rwanda USD 819 million (+14.4%), and Somalia USD 765 million (+13%).
These performances placed Tanzania among the top performers continent-wide in both FDI volume and growth.
UNCTAD attributes the increase in FDI to Tanzania to targeted investment facilitation and the use of public-private partnerships (PPPs), particularly in infrastructure and services.
Top 20 African Countries By FDI Volume 2024
| Rank 2024 | Country | FDI 2024 USDm |
| 1 | Egypt | 46,578 |
| 2 | Ethiopia | 3,984 |
| 3 | Ivory Coast | 3,802 |
| 4 | Mozambique | 3,553 |
| 5 | Uganda | 3,305 |
| 6 | Democratic Republic of the Congo | 3,113 |
| 7 | South Africa | 2,469 |
| 8 | Namibia | 2,063 |
| 9 | Senegal | 2,016 |
| 10 | Guinea | 1,828 |
| 11 | United Republic of Tanzania | 1,718 |
| 12 | Ghana | 1,669 |
| 13 | Morocco | 1,639 |
| 14 | Mauritania | 1,531 |
| 15 | Kenya | 1,503 |
| 16 | Algeria | 1,439 |
| 17 | Zambia | 1,238 |
| 18 | Gabon | 1,145 |
| 19 | Nigeria | 1,080 |
| 20 | Chad | 1,019 |
Top 20 African Countries By FDI Growth 2023-2024
| Rank 2024 | Country | FDI 2024 USDm | FDI 2023 USDm | YoY Growth % |
| 1 | Zambia | 1,238 | 86 | 1339.50% |
| 2 | Egypt | 46,578 | 9,841 | 373.30% |
| 3 | Eswatini | 93 | 29 | 220.70% |
| 4 | Botswana | 467 | 198 | 135.90% |
| 5 | Guinea | 1,828 | 893 | 104.70% |
| 6 | Mauritania | 1,531 | 878 | 74.40% |
| 7 | Morocco | 1,639 | 1,055 | 55.40% |
| 8 | Ivory Coast | 3,802 | 2,485 | 53.00% |
| 9 | Mozambique | 3,553 | 2,509 | 41.60% |
| 10 | Comoros | 7 | 5 | 40.00% |
| 11 | Guinea-Bissau | 27 | 20 | 35.00% |
| 12 | Equatorial Guinea | 188 | 142 | 32.40% |
| 13 | United Republic of Tanzania | 1,718 | 1,339 | 28.30% |
| 14 | Ghana | 1,669 | 1,308 | 27.60% |
| 15 | Seychelles | 299 | 237 | 26.20% |
| 16 | Benin | 543 | 443 | 22.60% |
| 17 | Ethiopia | 3,984 | 3,269 | 21.90% |
| 18 | Tunisia | 936 | 772 | 21.20% |
| 19 | Democratic Republic of the Congo | 3,113 | 2,576 | 20.80% |
| 20 | Algeria | 1,439 | 1,216 | 18.30% |
Africa FDI Perfomances 2024
Africa as a whole recorded USD 97.03 billion in FDI inflows in 2024, up 75% from 2023, mainly due to a single megaproject in Egypt. Excluding that transaction, the continent’s growth was 12%.
FDI outflows from Africa rose from USD 196 million in 2023 to USD 2.45 billion in 2024.
UNCTAD notes that investment growth across Africa remains uneven. FDI remains heavily concentrated in a few countries and sectors, particularly extractives, energy, and construction.
Greenfield investment in Africa’s digital economy is rising but remains limited in scale and focused on a small number of countries.
Manufacturing continues to stagnate across most of the continent.
International project finance value in Africa increased by 15% in 2024, supported by major energy and transport infrastructure deals.
Sustainable bond issuance also more than doubled, led by multilateral banks and sovereign entities.
Africa’s pharmaceutical sector continues to attract little FDI, with local production still underdeveloped and accounting for less than 5% of global greenfield projects in the last 20 years.


