


The Tanzania Communications Regulatory Authority (TCRA) reports that total telecom subscriptions reached 111.9 million in the quarter ending March 2026, up 4.6% from 106.9 million in December 2025.
Telecom Subscriptions
The total number of telecom subscriptions increased by 4.6% from 106.9 million at the end of December 2025 to 111.9 million as of March 2026.
The telecom penetration rate reached 159.8%.

Mobile subscriptions accounted for 99.9% of the total, with fixed subscriptions making up the remainder.
Tanzania Mobile and Fixed Subscriptions, Q1 2026
| Month | Mobile Subscriptions | Fixed Subscriptions | Total |
|---|---|---|---|
| January | 108,811,040 | 111,624 | 108,922,664 |
| February | 109,799,887 | 111,793 | 109,911,680 |
| March | 111,795,302 | 111,933 | 111,907,235 |
Mobile Subscriptions
SIM card subscriptions are categorised as Person-to-Person (P2P) and Machine-to-Machine (M2M).
P2P subscriptions increased by 4.7% and M2M subscriptions by 4.4% during the quarter.
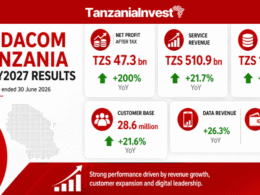
Vodacom (DSE: VODA) held the largest market share at 32.3%, followed by Yas at 28.5%, Airtel at 21.2%, Halotel at 16.4%, and TTCL at 1.6%.

Tanzania Telecom Subscriptions per Operator, Q1 2026
| Month | Airtel | Halotel | TTCL | Vodacom | Yas | Total |
|---|---|---|---|---|---|---|
| January | 23,760,566 | 17,802,344 | 1,755,666 | 34,356,508 | 31,247,580 | 108,922,664 |
| February | 23,732,394 | 17,946,016 | 1,778,005 | 35,208,226 | 31,247,039 | 109,911,680 |
| March | 23,752,094 | 18,315,764 | 1,801,693 | 36,186,939 | 31,850,745 | 111,907,235 |
Dar es Salaam led all regions with 20.6 million subscriptions, followed by Mwanza with 7.41 million, Arusha with 6.74 million, Mbeya with 6.44 million, and Dodoma with 5.97 million.
The smartphone penetration rate increased to 42.5% from 41.82% in December 2025, while the number of smartphones rose by 4.6% from 28.5 million to 29.8 million.
This growth was underpinned by continued infrastructure expansion, as the number of telecom towers grew from 10,029 in the quarter ending December 2025 to 10,084.
Mobile Network Coverage
Investment in telecommunication infrastructure has increased the rollout of mobile network coverage.
5G recorded the most notable increase, with population coverage expanding to 32.83% and geographical coverage to 11.04%, while the rollout of 5G base stations increased by 44% to 1,804 gNBs.
Tanzania Network Coverage for Mobile Network Signal, Q1 2026
| Technology | Coverage Type | December 2025 | March 2026 |
|---|---|---|---|
| 2G | Population | 98.64% | 98.65% |
| 3G | Population | 93.92% | 93.94% |
| 4G | Population | 94.21% | 94.32% |
| 5G | Population | 30.13% | 32.83% |
| 2G | Geographical | 79.47% | 79.62% |
| 3G | Geographical | 76.18% | 76.31% |
| 4G | Geographical | 77.31% | 77.43% |
| 5G | Geographical | 10.54% | 11.04% |
Mobile Money
Mobile Money Subscriptions
Mobile money subscriptions refer to the number of active SIM cards with mobile money accounts used at least once in the past three months.
Mobile money subscriptions increased by 5.9% from 76.47 million accounts in December 2025 to 80.98 million in March 2026.
The market remains highly concentrated, with Mixx by Yas, M-Pesa, and Airtel Money controlling 89.78% of subscriptions, led by M-Pesa at 40.97%, followed by Mixx by Yas at 31.02% and Airtel Money at 17.79%.
Mobile Money Transactions
Mobile money transactions increased by 7.4% during the quarter, reaching 1.99 billion in the quarter ending March 2026.
For the full year 2025, transactions reached 6.31 billion, up from 3.74 billion in 2024.
TCRA did not disclose the value of mobile money transactions in its report.
Internet Subscriptions
Internet subscriptions increased by 1.5% from 58.1 million in December 2025 to 58.9 million as of March 2026.
The internet penetration rate reached 84.2%.
Mobile broadband is the most popular means of accessing the internet, with 34.3 million subscriptions, representing 58% of total internet subscriptions.
2G technology holds significant usage with 24.2 million subscriptions.
Fibre technologies such as Fibre-to-the-Home (FTTH) and Fibre-to-the-Office (FTTO) account for a smaller share of subscriptions.
Internet data traffic increased by 15.3% from 808 petabytes in December 2025 to 932 petabytes in March 2026.
Local voice traffic declined by 3.8% to 45.4 billion minutes, and SMS traffic fell by 4.7% to 55.1 billion.
Fixed broadband recorded an average download speed of 28.3 Mbps, an average upload speed of 21.3 Mbps, and an average latency of 16.3 ms.
The total number of registered domain names increased from 36,223 at the end of December 2025 to 38,409 by the end of March 2026.
Approximately 16.5% of Tanzania’s international internet capacity is currently in use, leaving 14,775 Gbps, equivalent to 83.5%, available for new activation.
The gap between available and utilised international capacity represents an opportunity for further investment in broadband internet services.
Want to know more about Telecoms in Tanzania? Our free overview of the Tanzania Business and Investment Guide 2026 covers Telecoms, plus key sectors and investment opportunities. The complete 141-page edition includes policies, taxation, key regulations, full macroeconomic data, and sources.
Download Free OverviewGet the Full Guide