


Tanzania’s banking sector maintained strong profitability and financial stability in 2025, supported by continued credit expansion, improvements in transaction infrastructure, and accelerated digital adoption, according to an industry analysis of unaudited results prepared by AML Finance Limited.
The operating environment remained broadly supportive of lending activity, with sustained economic growth contributing to balance sheet expansion across institutions, while structural changes following the COVID-19 period continued to reshape banking models through increased reliance on digital platforms, agent networks, and automated customer onboarding systems.
These structural shifts are increasingly reflected in performance outcomes, where leading institutions have achieved significantly stronger efficiency levels than smaller competitors, reinforcing a widening divide across the sector.

Sector Structure and Market Concentration
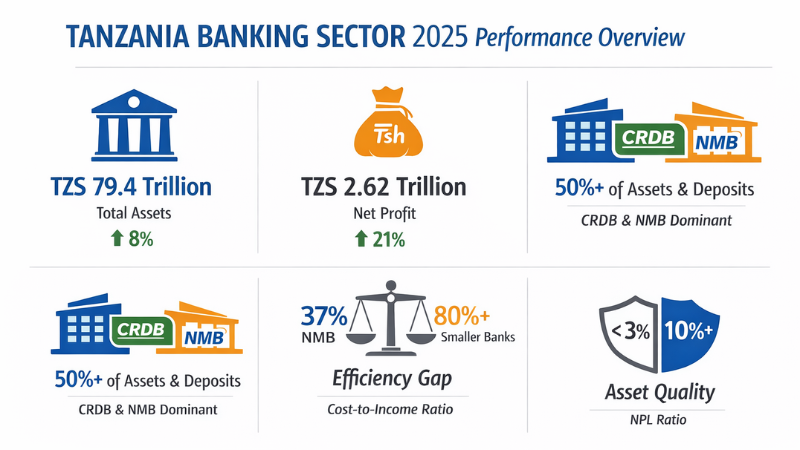
Market concentration remained a defining feature of the industry in 2025, with total assets captured in the dataset reaching TZS 79.4 trillion. The two largest banks, CRDB and NMB, accounted for approximately TZS 39.4 trillion combined, equivalent to nearly half of the total sector assets.
Deposit concentration followed a similar pattern, with the largest institutions holding more than 50% of deposits, strengthening their ability to price loans competitively, invest in technology, and absorb rising regulatory and compliance costs.
The scale gap between leading banks and the rest of the market has widened over time, as large institutions expanded their balance sheets while many smaller banks remained below TZS 1 trillion in assets, reinforcing a structural trend toward platform-based banking where size advantages compound through technology investment and operating leverage.
Profitability Trends
Profitability remained strong among leading banks and competitive by international commercial banking standards, with net income reaching TZS 551.5 billion at CRDB Bank Plc and TZS 646.9 billion at NMB Bank Plc.
Return on assets reached as high as 5.3% and return on equity exceeded 29% among major institutions, while other large banks also reported returns above 23%, indicating efficient income conversion and strong cost control.

However, performance across the sector was uneven, reflecting differences in business models, operational efficiency, and risk management rather than macroeconomic conditions alone.
Several banks recorded declines in net income, including Standard Chartered at -19%, Absa at -11%, Ecobank at -54%, and Citi at -53%, while others recorded strong profit growth, including Equity at +111%, Letshego at +79%, and Azania at +52%.
| Bank | Total Assets | Net Income After taxes 2025 | Net Income After taxes 2024 | % Variation | |
| 1 | CRDB bank PLC | 22,215,802 | 724,608 | 551,487 | 31 |
| 2 | NMB Bank PLC | 17,182,708 | 749,772 | 646,893 | 16 |
| 3 | National Bank of Commerce (NBC) | 5,351,961 | 148,987 | 117,792 | 26 |
| 4 | Exim Bank | 3,986,597 | 83,089 | 92,151 | (10) |
| 5 | Azania Bank PLC | 3,684,548 | 57,805 | 38,029 | 52 |
| 6 | Stanbic Bank | 3,502,177 | 135,325 | 128,005 | 6 |
| 7 | The Peoples Bank of Zanzibar | 2,805,126 | 79,712 | 62,750 | 27 |
| 8 | Tanzania Commercial Bank | 2,277,879 | 33,347 | 31,939 | 4 |
| 9 | Diamond Trust Bank Ltd (DTB) | 2,105,807 | 55,256 | 53,790 | 3 |
| 10 | KCB Bank | 1,863,251 | 66,793 | 50,812 | 31 |
| 11 | Standard Chartered Bank | 1,779,854 | 80,016 | 98,660 | (19) |
| 12 | ABSA | 1,772,970 | 63,266 | 71,107 | (11) |
| 13 | Equity Bank | 1,447,622 | 52,704 | 24,938 | 111 |
| 14 | Tanzania Agricultural Development b | 1,317,163 | 28,759 | 18,611 | 55 |
| 15 | Citi Bank | 1,000,907 | 32,045 | 67,845 | (53) |
| 16 | I & M Bank | 951,222 | 15,387 | 15,148 | 2 |
| 17 | Bank of Africa (BOA) | 805,258 | 7,332 | 13,119 | (44) |
| 18 | NCBA Bank Tanzania Ltd | 596,622 | 15,003 | 26,154 | (43) |
| 19 | Access (Bank ABC) | 535,454 | 5,391 | (2,659) | 303 |
| 20 | Ecobank Tanzania Ltd | 480,075 | 4,223 | 9,148 | (54) |
| 21 | Mwanga Hakika Bank | 470,076 | 12,582 | 9,973 | 26 |
| 22 | Habib African Bank Ltd | 388,512 | 3,112 | 4,078 | (24) |
| 23 | Amana Bank | 331,584 | 6,462 | 5,951 | 9 |
| 24 | Mkombozi Commercial Bank | 316,628 | 12,930 | 9,041 | 43 |
| 25 | Bank of Baroda | 274,126 | 4,459 | 5,848 | (24) |
| 26 | DCB Commercial Bank | 260,485 | 109 | (969) | (111) |
| 27 | Akiba Commercial Bank | 230,667 | (4,785) | (5,823) | 18 |
| 28 | Bank of India | 211,039 | 3,649 | 3,632 | 0.5 |
| 29 | Maendeleo Bank | 202,485 | 3,845 | 3,687 | 4 |
| 30 | China Dasheng Bank | 135,264 | 3,253 | 2,631 | 24 |
| 31 | Letshego Faidika Bank | 132,809 | 15,374 | 8,592 | 79 |
| 32 | United Bank for Africa (UBA) | 131,676 | (4,424) | (4,576) | 3 |
| 33 | Selcom Microfinance Bank | 102,266 | 1,866 | 1,280 | 46 |
| 34 | Mwalimu Commercial Bank PLC | 97,822 | 369 | 132 | 180 |
| 35 | FINCA Microfinance Bank | 96,547 | 997 | 475 | 110 |
| 36 | Guaranty Trust Bank TZ Limited | 78,088 | (277) | (1,911) | 86 |
| 37 | Uchumi Commercial Bank | 76,401 | 203 | 871 | (77) |
| 38 | International Commercial Bank | 66,338 | 1,455 | 676 | 115 |
| 39 | Vision Fund TZ Microfinance Bank Ltd | 63,131 | 1,889 | 1,865 | 1 |
| 40 | First Housing Finance Ltd | 49,615 | 439 | 412 | 7 |
| 41 | MUCOBA Bank PLC | 17,438 | (38) | 82 | (146) |
Income Structure and Revenue Composition
The sector remained predominantly driven by interest income, reflecting the central role of credit intermediation in banking activity, although non-interest income continued to expand and represented a major component of revenue among leading institutions.
CRDB generated TZS 684.7 billion in non-interest income and NMB generated TZS 631.2 billion, with both institutions deriving approximately 27% of total revenue from non-interest sources, highlighting the growing importance of transaction services and fee-based income in stabilizing earnings across credit cycles.
Among corporate and international banks, the contribution of non-interest income was even more pronounced, with Standard Chartered generating TZS 134.7 billion from non-interest sources compared to TZS 91.1 billion from interest income, meaning approximately 60% of its revenue was derived from transaction-driven activities.
Operating Efficiency and Productivity
Operating efficiency emerged as the clearest competitive differentiator across the sector, with leading banks reporting significantly lower cost-to-income ratios than smaller institutions.
NMB reported a ratio of 37%, CRDB 42.6%, and PBZ 32.3%, demonstrating strong operating leverage and the ability to scale revenue without proportional cost increases, while TCB recorded ratios above 70% and several smaller institutions reported ratios above 80% and in some cases above 100%, indicating structural profitability challenges.
Workforce productivity differences contributed to these efficiency gaps, as Tanzania’s output per worker is estimated at approximately USD 7,000 per year compared to around USD 120,000 in the world’s most productive economies, reinforcing the importance of digitisation, automation, and technology investment as the primary mechanisms for improving banking productivity.
Staff cost levels varied widely across institutions, but cost per employee alone did not determine efficiency, as banks with higher staff costs sometimes achieved stronger efficiency due to higher income generation per employee, while smaller institutions often recorded lower staff costs but weaker productivity outcomes.
Asset Quality and Risk Distribution
Asset quality remained strong among the largest banks, with non-performing loan ratios generally below 3%, including 3.0% at CRDB, 2.5% at NMB, 1.5% at Standard Chartered, 1.2% at Absa, 1.1% at Equity, and 0% at Citi, reflecting strengthened underwriting standards, improved monitoring, and stronger recovery capacity.
Because the largest institutions dominate sector assets and deposits, their stability plays a central role in anchoring confidence in the financial system.
However, credit risk remained more concentrated among smaller institutions, with several banks reporting non-performing loan ratios above 6%, some exceeding 10%, and extreme cases above 18%, indicating vulnerability in lower-tier banks where high credit risk combines with weak profitability and high operating costs.
Regional Comparison and Structural Trends
Sector trends in Tanzania were broadly consistent with developments across East Africa, including Kenya, Uganda, and Rwanda, where banking industries are becoming more concentrated with stronger efficiency among large platform banks and rising structural pressure on smaller institutions facing increasing compliance and technology costs.
Concentration indicators, including the Herfindahl–Hirschman Index, suggest deposits, payments, and credit distribution are increasingly dominated by a small number of large banks, which may improve efficiency and stability at the top but also concentrate systemic risk and reduce competitive pressure over time.
Credit Growth and Outlook
Credit to the private sector continued to expand in 2025, with average growth reaching 16.20% compared to 17.03% in 2024 and 21.91% in 2023, indicating sustained lending activity despite moderation from earlier peaks.
The short-term outlook for the sector remains positive, supported by strong deposit bases, expanding non-interest income, and efficiency advantages among leading institutions.
Over the longer term, further consolidation appears likely, as institutions with persistent cost-to-income ratios above 70% and non-performing loan ratios above 6% may require restructuring, recapitalisation, or strategic repositioning to remain competitive.
The sector is expected to evolve toward a structure dominated by a smaller number of large platform banks controlling deposits, payments, and mass-market lending.
In contrast, smaller institutions consolidate or focus on niche segments, with future competitiveness increasingly dependent on digital systems, data, automation capacity, and analytics alongside traditional financial capital.
Want to know more about Banking in Tanzania? Our free overview of the Tanzania Business and Investment Guide 2026 covers Banking, plus key sectors and investment opportunities. The complete 141-page edition includes policies, taxation, key regulations, full macroeconomic data, and sources.
Download Free OverviewGet the Full Guide


