According to the Tanzania Banking Sector Performance Report for Q1 2026, published by AML Finance Limited and authored by Managing Director Reginald Massawe, the country’s banking sector grew by about 16%, confirming that the sector continues to expand its earnings capacity.
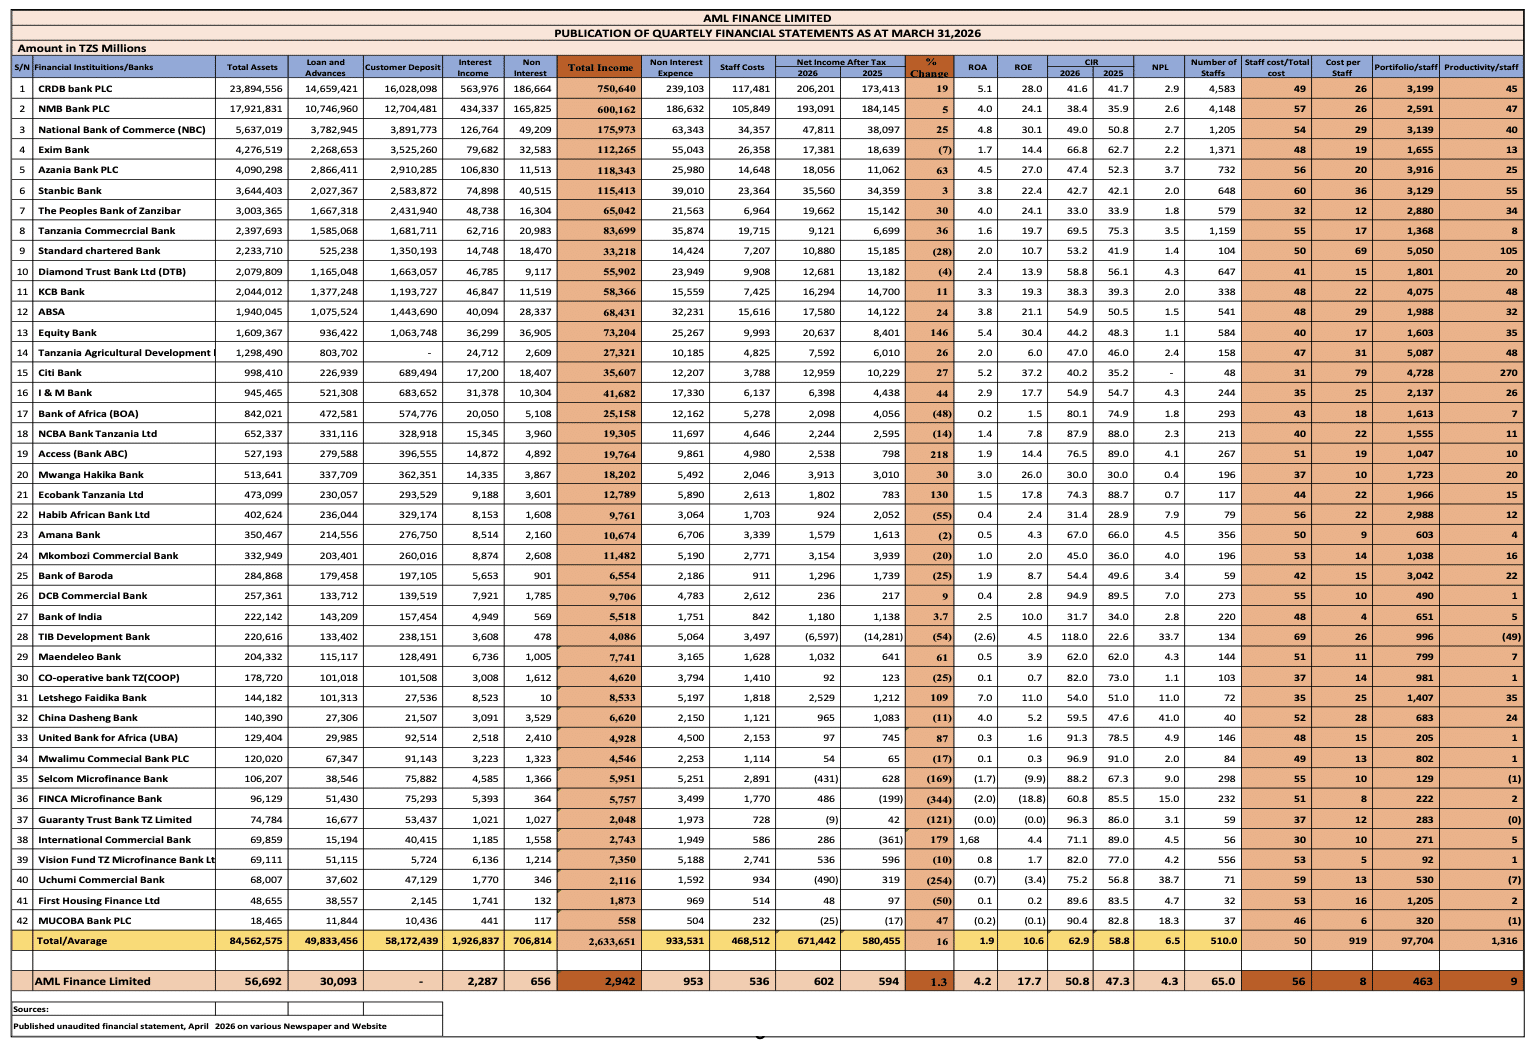
The analysis is based on published unaudited financial statements as at 31 March 2026, covering 42 banks and financial institutions, noting that Akiba Commercial Bank financials were not available at the time of analysis.
Performance Overview
Total income reached approximately TZS 2.65 trillion and net profit after tax of approximately TZS 671 billion, compared with approximately TZS 580 billion in the corresponding period of 2025.
Total banking sector assets stand at approximately TZS 84.6 trillion, with combined loans and advances of TZS 49.8 trillion and customer deposits of TZS 58.2 trillion.
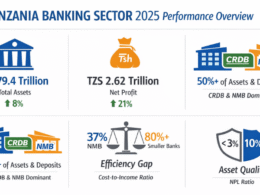
This compares with full-year 2025 sector assets of TZS 79.4 trillion reported in the previous AML Finance analysis, indicating continued balance sheet expansion.
The sector’s average return on assets stands at approximately 1.9% and return on equity at approximately 10.6%, with figures annualized based on Q1 performance.
The average non-performing loan (NPL) ratio is approximately 6.5%, while the average cost-to-income ratio (CIR) stands at 62.9%.
Concentration
The top five banks—CRDB, NMB, NBC, Stanbic, and Standard Chartered—collectively account for an estimated 60–65% of total assets.
CRDB Bank Plc reports total assets of TZS 23.9 trillion, while NMB Bank Plc reports TZS 17.9 trillion, together representing TZS 41.8 trillion or close to half of the sector.
National Bank of Commerce (NBC) follows with assets of TZS 5.6 trillion, ahead of Exim Bank at TZS 4.3 trillion and Azania Bank at TZS 4.1 trillion.
Reginald Massawe stresses that the rivalry between CRDB and NMB resembles the classic competition between Coca-Cola and Pepsi: two dominant players continuously pushing each other on scale, reach, and execution, thereby raising performance standards across the industry while widening the gap with smaller competitors.
He concludes that the sector is not converging—it is concentrating, with leadership and board oversight increasingly determining which institutions strengthen their position and which face structural pressure.
Profitability and Returns
CRDB increased its net profit from approximately TZS 173 billion in Q1 2025 to over TZS 206 billion in Q1 2026, a growth of 19%.
NMB recorded net profit of TZS 193 billion in Q1 2026 against TZS 184 billion in Q1 2025, while NBC posted TZS 47.8 billion, up 25% from TZS 38.1 billion.
Equity Bank recorded the strongest profit growth among mid-sized banks, with net income rising 146% to TZS 20.6 billion from TZS 8.4 billion.
Azania Bank profit increased 63% to TZS 18.1 billion, while Letshego Faidika Bank profit more than doubled to TZS 2.5 billion (+109%).
Citi Bank delivered the highest ROE in the sector at 37.2%, followed by Equity Bank at 30.4% and NBC at 30.1%.
CRDB recorded ROE of 28.0% and ROA of 5.1%, while NMB posted ROE of 24.1% and ROA of 4.0%.
On the other side, several institutions reported declining profitability or losses.
Standard Chartered profit declined 28% to TZS 10.9 billion, Bank of Africa fell 48% to TZS 2.1 billion, and Habib African Bank dropped 55% to TZS 924 million.
TIB Development Bank reported a loss of TZS 6.6 billion, while Selcom Microfinance Bank, Uchumi Commercial Bank, and FINCA Microfinance Bank also posted losses.
Cost Efficiency and Asset Quality
Mwanga Hakika Bank reported the lowest CIR at 30.0%, followed by Bank of India at 31.7%, Habib African Bank at 31.4%, and the Peoples Bank of Zanzibar at 33.0%.
NMB operated at CIR of 38.4%, Standard Chartered at 53.2%, CRDB at 41.6%, KCB Bank at 38.3%, and Stanbic at 42.7%.
In contrast, several institutions operate above 90%, including TIB Development Bank at 118.0%, Mwalimu Commercial Bank at 96.9%, Guaranty Trust Bank Tanzania at 96.3%, DCB Commercial Bank at 94.9%, United Bank for Africa at 91.3%, and MUCOBA Bank at 90.4%.
Citi Bank continues to report an NPL ratio of 0%, while Equity Bank stands at 1.1%, Standard Chartered at 1.4%, ABSA at 1.5%, and Mwanga Hakika Bank at 0.4%.
CRDB reports NPL of 2.9% and NMB of 2.6%, both below the sector average of 6.5%.
At the higher end, China Dasheng Bank reports NPL of 41.0%, Uchumi Commercial Bank 38.7%, MUCOBA Bank 18.3%, FINCA Microfinance Bank 15.0%, and Letshego Faidika Bank 11.0%.
Productivity and Income Structure
The sector average for portfolio per staff stands at approximately TZS 919 million, with leading institutions operating at substantially higher levels.
Citi Bank records portfolio per staff of TZS 4.7 billion, Standard Chartered TZS 5.1 billion, Tanzania Agricultural Development Bank (TADB) TZS 5.1 billion, KCB Bank TZS 4.1 billion, and Azania Bank TZS 3.9 billion.
The sector remains predominantly driven by interest income, with total interest income of TZS 1.93 trillion against non-interest income of TZS 706.8 billion in Q1 2026.
Private sector credit grew by approximately 23% during the period, supporting earnings expansion across lending-focused institutions.
Banking Sector Structure and Macroeconomic Context
Banking sector assets are estimated at approximately 35–45% of GDP, while private sector credit stands at roughly 20–25% of GDP.
This compares with higher levels in regional peers such as Kenya, where private sector credit exceeds 30% of GDP, and significantly deeper systems such as South Africa, where banking assets exceed 100% of GDP.
In East Africa, countries such as Kenya typically record private sector credit growth of 10–15% in stable periods, while in more developed economies credit growth is significantly lower at 3–8% annually.
Globally, top-performing banks in developed markets operate at cost-to-income ratios closer to 40–50%, supported by digitalization and scale, with the leading Tanzanian banks beginning to approach these levels.
The findings extend the structural trends identified in the AML Finance 2025 full-year analysis, which showed that CRDB and NMB alone accounted for close to half of total sector assets at the end of 2025, with combined deposits exceeding 50% of the system total.
Tanzania Bank Performance Q1, 2026
Want to know more about Banking in Tanzania? Our free Tanzania Business and Investment Guide 2026 covers Banking, plus regulations, key sectors, and investment opportunities—all in one place.
Download Free Guide